XM Radio 2011 Annual Report Download - page 63
Download and view the complete annual report
Please find page 63 of the 2011 XM Radio annual report below. You can navigate through the pages in the report by either clicking on the pages listed below, or by using the keyword search tool below to find specific information within the annual report.-
 1
1 -
2
-
3
-
4
-
5
-
6
-
7
-
8
-
9
-
10
-
11
-
12
-
13
-
14
-
15
-
16
-
17
-
18
-
19
-
20
-
21
-
22
-
23
-
24
-
25
-
26
-
27
-
28
-
29
-
30
-
31
-
32
-
33
-
34
-
35
-
36
-
37
-
38
-
39
-
40
-
41
-
42
-
43
-
44
-
45
-
46
-
47
-
48
-
49
-
50
-
51
-
52
-
 53
53 -
 54
54 -
 55
55 -
 56
56 -
 57
57 -
 58
58 -
 59
59 -
 60
60 -
 61
61 -
 62
62 -
 63
63 -
 64
64 -
 65
65 -
 66
66 -
 67
67 -
 68
68 -
 69
69 -
 70
70 -
 71
71 -
 72
72 -
 73
73 -
74
-
75
-
76
-
77
-
78
-
79
-
80
-
81
-
82
-
83
-
84
-
85
-
86
-
87
-
88
-
89
-
90
-
91
-
92
-
93
-
94
-
95
-
96
-
97
-
98
-
99
-
100
-
101
-
102
-
103
-
104
-
105
-
106
-
107
-
108
-
109
-
110
-
111
-
112
-
113
-
114
-
115
-
116
-
117
-
118
-
119
-
120
-
121
-
122
-
123
-
124
-
125
-
126
-
127
-
128
-
129
-
130
-
131
-
132
 |
 |
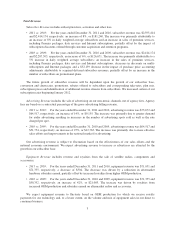
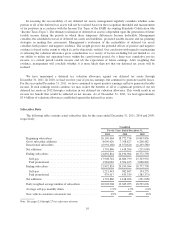
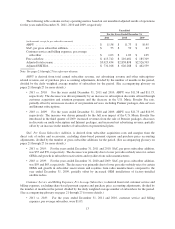
Sales and Marketing includes costs for advertising, media and production, including promotional events and
sponsorships; cooperative marketing; subscriber communications; customer retention and personnel. Cooperative
marketing costs include fixed and variable payments to reimburse retailers and automakers for the cost of
advertising and other product awareness activities performed on our behalf.
•2011 vs. 2010: For the years ended December 31, 2011 and 2010, sales and marketing expenses were
$222,773 and $215,454, respectively, an increase of 3%, or $7,319, and decreased as a percentage of total
revenue. The increase was primarily due to increased subscriber communications and retention programs
associated with a greater number of subscribers and promotional trials, partially offset by reductions in
consumer advertising and event marketing.
•2010 vs. 2009: For the years ended December 31, 2010 and 2009, sales and marketing expenses were
$215,454 and $228,956, respectively, a decrease of 6%, or $13,502, and decreased as a percentage of total
revenue. The decrease was primarily due to reductions in consumer advertising, event marketing and third
party distribution support expenses, partially offset by additional cooperative marketing and personnel
costs.
Sales and marketing expenses will fluctuate on a quarterly basis as we launch seasonal advertising and
promotional initiatives to attract new subscribers in existing and new distribution channels, and launch and
expand programs to retain our existing subscribers and win-back former subscribers.
Engineering, Design and Development includes costs to develop chip sets and new products, research and
development for broadcast information systems and costs associated with the incorporation of our radios into
vehicles manufactured by automakers.
•2011 vs. 2010: For the years ended December 31, 2011 and 2010, engineering, design and development
expenses were $53,435 and $45,390, respectively, an increase of 18%, or $8,045, and remained flat as a
percentage of total revenue. The increase was primarily due to higher product development costs and
costs related to enhanced subscriber features and functionality, partially offset by lower share-based
payment expenses.
•2010 vs. 2009: For the years ended December 31, 2010 and 2009, engineering, design and development
expenses were $45,390 and $41,031, respectively, an increase of 11%, or $4,359, and remained flat as a
percentage of total revenue. The increase was primarily due to higher personnel, overhead and
aftermarket product development costs.
We expect engineering, design and development expenses to increase in future periods as we develop our
next generation chip sets and products.
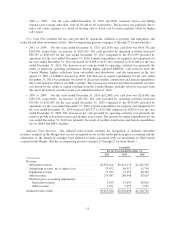
General and Administrative includes executive management, rent and occupancy, finance, legal, human
resources, information technology, insurance and investor relations costs.
•2011 vs. 2010: For the years ended December 31, 2011 and 2010, general and administrative expenses
were $238,738 and $240,970, respectively, a decrease of 1%, or $2,232, and decreased as a percentage of
total revenue. The decrease was primarily due to lower share-based payment expense, as well as lower
general operating expenses, including rent, insurance and information technology costs.
•2010 vs. 2009: For the years ended December 31, 2010 and 2009, general and administrative expenses
were $240,970 and $227,554, respectively, an increase of 6%, or $13,416, and decreased as a percentage
of total revenue. The increase was primarily due to increased personnel and legal costs, partially offset by
lower share-based payment expense.
We expect our general and administrative expenses to increase in future periods primarily as a result of
enhanced information technology and personnel costs to support the growth of our business.
7