XM Radio 2011 Annual Report Download - page 71
Download and view the complete annual report
Please find page 71 of the 2011 XM Radio annual report below. You can navigate through the pages in the report by either clicking on the pages listed below, or by using the keyword search tool below to find specific information within the annual report.-
 1
1 -
2
-
3
-
4
-
5
-
6
-
7
-
8
-
9
-
10
-
11
-
12
-
13
-
14
-
15
-
16
-
17
-
18
-
19
-
20
-
21
-
22
-
23
-
24
-
25
-
26
-
27
-
28
-
29
-
30
-
31
-
32
-
33
-
34
-
35
-
36
-
37
-
38
-
39
-
40
-
41
-
42
-
43
-
44
-
45
-
46
-
47
-
48
-
49
-
50
-
51
-
52
-
53
-
54
-
55
-
56
-
57
-
58
-
59
-
60
-
 61
61 -
 62
62 -
 63
63 -
 64
64 -
 65
65 -
 66
66 -
 67
67 -
 68
68 -
 69
69 -
 70
70 -
 71
71 -
 72
72 -
 73
73 -
 74
74 -
 75
75 -
 76
76 -
 77
77 -
 78
78 -
 79
79 -
 80
80 -
 81
81 -
82
-
83
-
84
-
85
-
86
-
87
-
88
-
89
-
90
-
91
-
92
-
93
-
94
-
95
-
96
-
97
-
98
-
99
-
100
-
101
-
102
-
103
-
104
-
105
-
106
-
107
-
108
-
109
-
110
-
111
-
112
-
113
-
114
-
115
-
116
-
117
-
118
-
119
-
120
-
121
-
122
-
123
-
124
-
125
-
126
-
127
-
128
-
129
-
130
-
131
-
132
 |
 |

Adjusted EBITDA. EBITDA is defined as net income (loss) before interest and investment income (loss);
interest expense, net of amounts capitalized; income tax expense and depreciation and amortization. Adjusted
EBITDA removes the impact of other income and expense, losses on extinguishment of debt as well as certain
other charges, such as goodwill impairment; restructuring, impairments and related costs; certain purchase price
accounting adjustments and share-based payment expense. (See the accompanying glossary on pages 21 through
27 for more details):
•2011 vs. 2010: For the years ended December 31, 2011 and 2010, adjusted EBITDA was $731,018 and
$626,288, respectively, an increase of 17%, or $104,730. The increase was primarily due to an increase of
7%, or $186,536, in adjusted revenues, partially offset by an increase of 4%, or $81,806, in expenses
included in adjusted EBITDA. The increase in adjusted revenues was primarily due to the increase in our
subscriber base. The increase in expenses was primarily driven by higher revenue share and royalties
expenses associated with growth in revenues, increased customer service and billing expenses associated
with subscriber growth and higher subscriber acquisition costs related to the 12% increase in gross
additions, partially offset by lower programming and content costs.
•2010 vs. 2009: For the years ended December 31, 2010 and 2009, adjusted EBITDA was $626,288 and
$462,539, respectively, an increase of 35%, or $163,749. The increase was primarily due to an increase of
12%, or $312,195, in adjusted revenues, partially offset by an increase of 7%, or $148,446, in expenses
included in adjusted EBITDA. The increase in revenue was primarily due to the increase in our subscriber
base and the introduction of the U.S. Music Royalty Fee in the third quarter of 2009, as well as increased
advertising and equipment revenue, decreases in discounts on multi-subscription and Internet packages,
and an increase in the sale of “Best of” programming, partially offset by an increase in the number of
subscribers on promotional plans. The increase in expenses was primarily driven by higher subscriber
acquisition costs related to the 25% increase in gross additions and higher revenue share and royalties
expenses associated with growth in revenues subject to revenue sharing and royalty arrangements.
Liquidity and Capital Resources
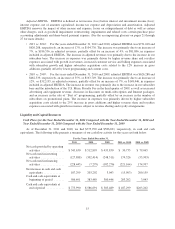
Cash Flows for the Year Ended December 31, 2011 Compared with the Year Ended December 31, 2010 and
Year Ended December 31, 2010 Compared with the Year Ended December 31, 2009
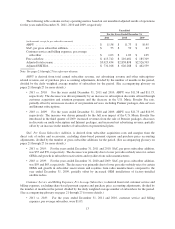
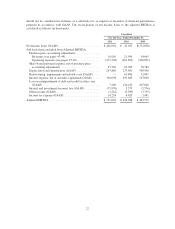
As of December 31, 2011 and 2010, we had $773,990 and $586,691, respectively, in cash and cash
equivalents. The following table presents a summary of our cash flow activity for the years set forth below:
For the Years Ended December 31,
2011 2010 2009 2011 vs. 2010 2010 vs. 2009
Net cash provided by operating
activities ................ $543,630 $ 512,895 $ 433,830 $ 30,735 $ 79,065
Net cash used in investing
activities ................ (127,888) (302,414) (248,511) 174,526 (53,903)
Net cash used in financing
activities ................ (228,443) (7,279) (182,276) (221,164) 174,997
Net increase in cash and cash
equivalents .............. 187,299 203,202 3,043 (15,903) 200,159
Cash and cash equivalents at
beginning of period ....... 586,691 383,489 380,446 203,202 3,043
Cash and cash equivalents at
end of period ............ $773,990 $ 586,691 $ 383,489 $ 187,299 $203,202
15