XM Radio 2011 Annual Report Download - page 59
Download and view the complete annual report
Please find page 59 of the 2011 XM Radio annual report below. You can navigate through the pages in the report by either clicking on the pages listed below, or by using the keyword search tool below to find specific information within the annual report.-
 1
1 -
2
-
3
-
4
-
5
-
6
-
7
-
8
-
9
-
10
-
11
-
12
-
13
-
14
-
15
-
16
-
17
-
18
-
19
-
20
-
21
-
22
-
23
-
24
-
25
-
26
-
27
-
28
-
29
-
30
-
31
-
32
-
33
-
34
-
35
-
36
-
37
-
38
-
39
-
40
-
41
-
42
-
43
-
44
-
45
-
46
-
47
-
48
-
 49
49 -
 50
50 -
 51
51 -
 52
52 -
 53
53 -
 54
54 -
 55
55 -
 56
56 -
 57
57 -
 58
58 -
 59
59 -
 60
60 -
 61
61 -
 62
62 -
 63
63 -
 64
64 -
 65
65 -
 66
66 -
 67
67 -
 68
68 -
 69
69 -
70
-
71
-
72
-
73
-
74
-
75
-
76
-
77
-
78
-
79
-
80
-
81
-
82
-
83
-
84
-
85
-
86
-
87
-
88
-
89
-
90
-
91
-
92
-
93
-
94
-
95
-
96
-
97
-
98
-
99
-
100
-
101
-
102
-
103
-
104
-
105
-
106
-
107
-
108
-
109
-
110
-
111
-
112
-
113
-
114
-
115
-
116
-
117
-
118
-
119
-
120
-
121
-
122
-
123
-
124
-
125
-
126
-
127
-
128
-
129
-
130
-
131
-
132
 |
 |
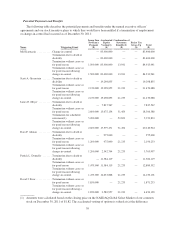
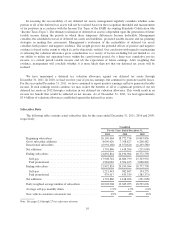
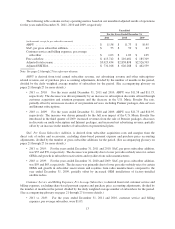
Total Revenue
Subscriber Revenue includes subscription fees, activation and other fees.
•2011 vs. 2010: For the years ended December 31, 2011 and 2010, subscriber revenue was $2,595,414
and $2,414,174, respectively, an increase of 8%, or $181,240. The increase was primarily attributable to
an increase of 8% in daily weighted average subscribers and an increase in sales of premium services,
including Premier packages, data services and Internet subscriptions, partially offset by the impact of
subscription discounts offered through customer acquisition and retention programs.
•2010 vs. 2009: For the years ended December 31, 2010 and 2009, subscriber revenue was $2,414,174
and $2,287,503, respectively, an increase of 6%, or $126,671. The increase was primarily attributable to a
5% increase in daily weighted average subscribers; an increase in the sales of premium services,
including Premier packages, data services and Internet subscriptions; decreases in discounts on multi-
subscription and Internet packages and a $32,159 decrease in the impact of purchase price accounting
adjustments attributable to acquired deferred subscriber revenues, partially offset by an increase in the
number of subscribers on promotional plans.
The future growth of subscriber revenue will be dependent upon the growth of our subscriber base,
conversion and churn rates, promotions, rebates offered to subscribers and corresponding take-rates, plan mix,
subscription prices and identification of additional revenue streams from subscribers. We increased certain of our
subscription rates beginning January 2012.
Advertising Revenue includes the sale of advertising on our non-music channels, net of agency fees. Agency
fees are based on a contractual percentage of the gross advertising billing revenue.
•2011 vs. 2010: For the years ended December 31, 2011 and 2010, advertising revenue was $73,672 and
$64,517, respectively, an increase of 14%, or $9,155. The increase was primarily due to greater demand
for audio advertising resulting in increases in the number of advertising spots sold as well as the rate
charged per spot.
•2010 vs. 2009: For the years ended December 31, 2010 and 2009, advertising revenue was $64,517 and
$51,754, respectively, an increase of 25%, or $12,763. The increase was primarily due to more effective
sales efforts and improvements in the national market for advertising.
Our advertising revenue is subject to fluctuation based on the effectiveness of our sales efforts and the
national economic environment. We expect advertising revenue to increase as advertisers are attracted by the
growth in our subscriber base.
Equipment Revenue includes revenue and royalties from the sale of satellite radios, components and
accessories.
•2011 vs. 2010: For the years ended December 31, 2011 and 2010, equipment revenue was $71,051 and
$71,355, respectively, a decrease of $304. The decrease was driven by a reduction in aftermarket
hardware subsidies earned, partially offset by increased royalties from higher OEM production.
•2010 vs. 2009: For the years ended December 31, 2010 and 2009, equipment revenue was $71,355 and
$50,352, respectively, an increase of 42%, or $21,003. The increase was driven by royalties from
increased OEM production and subsidies earned on aftermarket radios and accessories.
We expect equipment revenue to fluctuate based on OEM production for which we receive royalty
payments for our technology and, to a lesser extent, on the volume and mix of equipment sales in our direct to
consumer business.
3