XM Radio 2011 Annual Report Download - page 91
Download and view the complete annual report
Please find page 91 of the 2011 XM Radio annual report below. You can navigate through the pages in the report by either clicking on the pages listed below, or by using the keyword search tool below to find specific information within the annual report.-
 1
1 -
2
-
3
-
4
-
5
-
6
-
7
-
8
-
9
-
10
-
11
-
12
-
13
-
14
-
15
-
16
-
17
-
18
-
19
-
20
-
21
-
22
-
23
-
24
-
25
-
26
-
27
-
28
-
29
-
30
-
31
-
32
-
33
-
34
-
35
-
36
-
37
-
38
-
39
-
40
-
41
-
42
-
43
-
44
-
45
-
46
-
47
-
48
-
49
-
50
-
51
-
52
-
53
-
54
-
55
-
56
-
57
-
58
-
59
-
60
-
61
-
62
-
63
-
64
-
65
-
66
-
67
-
68
-
69
-
70
-
71
-
72
-
73
-
74
-
75
-
76
-
77
-
78
-
79
-
80
-
 81
81 -
 82
82 -
 83
83 -
 84
84 -
 85
85 -
 86
86 -
 87
87 -
 88
88 -
 89
89 -
 90
90 -
 91
91 -
 92
92 -
 93
93 -
 94
94 -
 95
95 -
 96
96 -
 97
97 -
 98
98 -
 99
99 -
 100
100 -
 101
101 -
102
-
103
-
104
-
105
-
106
-
107
-
108
-
109
-
110
-
111
-
112
-
113
-
114
-
115
-
116
-
117
-
118
-
119
-
120
-
121
-
122
-
123
-
124
-
125
-
126
-
127
-
128
-
129
-
130
-
131
-
132
 |
 |

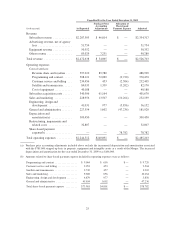
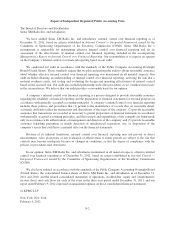
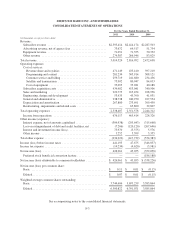
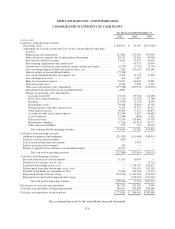
SIRIUS XM RADIO INC. AND SUBSIDIARIES
CONSOLIDATED STATEMENTS OF OPERATIONS
For the Years Ended December 31,
2011 2010 2009
(in thousands, except per share data)
Revenue:
Subscriber revenue ........................................ $2,595,414 $2,414,174 $2,287,503
Advertising revenue, net of agency fees ........................ 73,672 64,517 51,754
Equipment revenue ........................................ 71,051 71,355 50,352
Other revenue ............................................ 274,387 266,946 83,029
Total revenue ............................................... 3,014,524 2,816,992 2,472,638
Operating expenses:
Cost of services:
Revenue share and royalties ............................... 471,149 435,410 397,210
Programming and content ................................. 281,234 305,914 308,121
Customer service and billing ............................... 259,719 241,680 234,456
Satellite and transmission ................................. 75,902 80,947 84,033
Cost of equipment ....................................... 33,095 35,281 40,188
Subscriber acquisition costs ................................. 434,482 413,041 340,506
Sales and marketing ....................................... 222,773 215,454 228,956
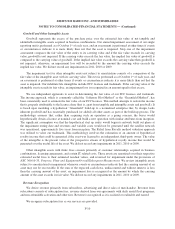
Engineering, design and development ......................... 53,435 45,390 41,031
General and administrative .................................. 238,738 240,970 227,554
Depreciation and amortization ............................... 267,880 273,691 309,450
Restructuring, impairments and related costs .................... — 63,800 32,807
Total operating expenses ...................................... 2,338,407 2,351,578 2,244,312
Income from operations .................................... 676,117 465,414 228,326
Other income (expense):
Interest expense, net of amounts capitalized ..................... (304,938) (295,643) (315,668)
Loss on extinguishment of debt and credit facilities, net ........... (7,206) (120,120) (267,646)
Interest and investment income (loss) .......................... 73,970 (5,375) 5,576
Other income ............................................. 3,252 3,399 3,355
Total other expense .......................................... (234,922) (417,739) (574,383)
Income (loss) before income taxes .............................. 441,195 47,675 (346,057)
Income tax expense .......................................... (14,234) (4,620) (5,981)
Net income (loss) ........................................... 426,961 43,055 (352,038)
Preferred stock beneficial conversion feature .................... — — (186,188)
Net income (loss) attributable to common stockholders .............. $ 426,961 $ 43,055 $ (538,226)
Net income (loss) per common share:
Basic ................................................... $ 0.11 $ 0.01 $ (0.15)
Diluted .................................................. $ 0.07 $ 0.01 $ (0.15)
Weighted average common shares outstanding:
Basic ................................................... 3,744,606 3,693,259 3,585,864
Diluted .................................................. 6,500,822 6,391,071 3,585,864
See accompanying notes to the consolidated financial statements.
F-3