XM Radio 2011 Annual Report Download - page 72
Download and view the complete annual report
Please find page 72 of the 2011 XM Radio annual report below. You can navigate through the pages in the report by either clicking on the pages listed below, or by using the keyword search tool below to find specific information within the annual report.-
 1
1 -
2
-
3
-
4
-
5
-
6
-
7
-
8
-
9
-
10
-
11
-
12
-
13
-
14
-
15
-
16
-
17
-
18
-
19
-
20
-
21
-
22
-
23
-
24
-
25
-
26
-
27
-
28
-
29
-
30
-
31
-
32
-
33
-
34
-
35
-
36
-
37
-
38
-
39
-
40
-
41
-
42
-
43
-
44
-
45
-
46
-
47
-
48
-
49
-
50
-
51
-
52
-
53
-
54
-
55
-
56
-
57
-
58
-
59
-
60
-
61
-
 62
62 -
 63
63 -
 64
64 -
 65
65 -
 66
66 -
 67
67 -
 68
68 -
 69
69 -
 70
70 -
 71
71 -
 72
72 -
 73
73 -
 74
74 -
 75
75 -
 76
76 -
 77
77 -
 78
78 -
 79
79 -
 80
80 -
 81
81 -
 82
82 -
83
-
84
-
85
-
86
-
87
-
88
-
89
-
90
-
91
-
92
-
93
-
94
-
95
-
96
-
97
-
98
-
99
-
100
-
101
-
102
-
103
-
104
-
105
-
106
-
107
-
108
-
109
-
110
-
111
-
112
-
113
-
114
-
115
-
116
-
117
-
118
-
119
-
120
-
121
-
122
-
123
-
124
-
125
-
126
-
127
-
128
-
129
-
130
-
131
-
132
 |
 |

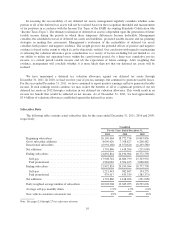
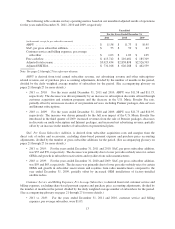
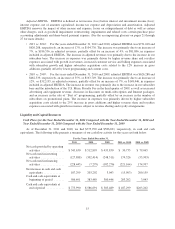
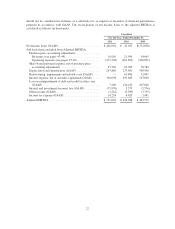
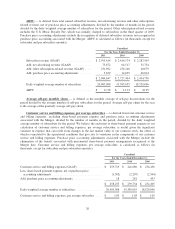
Cash Flows Provided by Operating Activities
Cash provided by operating activities increased by $30,735, or 6%, to $543,630 for the year ended
December 31, 2011 from $512,895 for the year ended December 31, 2010. Cash provided by operating activities
increased by $79,065, or 18%, to $512,895 for the year ended December 31, 2010 from cash provided by
operating activities of $433,830 for the year ended December 31, 2009. The primary drivers of our operating
cash flow growth have been improvements in profitability and changes in operating assets and liabilities.
• Our net income (loss) was $426,691, $43,055, and ($352,038) for the years ended December 31, 2011,
2010 and 2009, respectively. Our net income growth has been primarily due to growth in our subscriber
revenues which increased by $181,240, or 8%, and $126,671, or 6%, for the years ended December 31,
2011 and 2010, respectively.
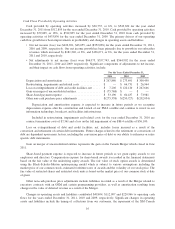
• Net adjustments to net income (loss) were $66,975, $357,743, and $564,902 for the years ended
December 31, 2011, 2010 and 2009, respectively. Significant components of adjustments to net income,
and their impact on cash flows from operating activities, include:
For the Years Ended December 31,
2011 2010 2009
Depreciation and amortization ......................... $267,880 $ 273,691 $ 309,450
Restructuring, impairments and related costs ............. $ — $ 66,731 $ 26,964
Loss on extinguishment of debt and credit facilities, net ..... $ 7,206 $ 120,120 $ 267,646
Gain on merger of unconsolidated entities ................ $ (75,768) $ — $ —
Share-based payment expense ......................... $ 53,190 $ 60,437 $ 73,981
Other non-cash purchase price adjustments ............... $(275,338) $(250,727) $(202,054)
Depreciation and amortization expense is expected to increase in future periods as we recognize
depreciation expense after the construction and launch of our FM-6 satellite and continue to invest in our
information technology, broadcast, and facilities infrastructures.
Included in restructuring, impairments and related costs for the year ended December 31, 2010 are
contract termination costs of $7,361 and a loss on the full impairment of our FM-4 satellite of $56,100.
Loss on extinguishment of debt and credit facilities, net, includes losses incurred as a result of the
conversion and retirement of certain debt instruments. Future charges related to the retirement or conversions of
debt are dependent upon many factors, including the conversion price of debt or our ability to refinance or retire
specific debt instruments.
Gain on merger of unconsolidated entities represents the gain on the Canada Merger which closed in June
2011.
Share-based payment expense is expected to increase in future periods as we grant equity awards to our
employees and directors. Compensation expense for share-based awards is recorded in the financial statements
based on the fair value of the underlying equity awards. The fair value of stock option awards is determined
using the Black-Scholes-Merton option-pricing model which is subject to various assumptions including the
market price of our common stock, estimated forfeiture rates of awards and the volatility of our stock price. The
fair value of restricted shares and restricted stock units is based on the market price of our common stock at date
of grant.
Other non-cash purchase price adjustments include liabilities recorded as a result of the Merger related to
executory contracts with an OEM and certain programming providers, as well as amortization resulting from
changes in the value of deferred revenue as a result of the Merger.
Changes in operating assets and liabilities contributed $49,694, $112,097 and $220,966 to operating cash
flows for the years ended December 31, 2011, 2010 and 2009, respectively. Significant changes in operating
assets and liabilities include the timing of collections from our customers, the repayment of the XM Canada
16