XM Radio 2011 Annual Report Download - page 69
Download and view the complete annual report
Please find page 69 of the 2011 XM Radio annual report below. You can navigate through the pages in the report by either clicking on the pages listed below, or by using the keyword search tool below to find specific information within the annual report.-
 1
1 -
2
-
3
-
4
-
5
-
6
-
7
-
8
-
9
-
10
-
11
-
12
-
13
-
14
-
15
-
16
-
17
-
18
-
19
-
20
-
21
-
22
-
23
-
24
-
25
-
26
-
27
-
28
-
29
-
30
-
31
-
32
-
33
-
34
-
35
-
36
-
37
-
38
-
39
-
40
-
41
-
42
-
43
-
44
-
45
-
46
-
47
-
48
-
49
-
50
-
51
-
52
-
53
-
54
-
55
-
56
-
57
-
58
-
 59
59 -
 60
60 -
 61
61 -
 62
62 -
 63
63 -
 64
64 -
 65
65 -
 66
66 -
 67
67 -
 68
68 -
 69
69 -
 70
70 -
 71
71 -
 72
72 -
 73
73 -
 74
74 -
 75
75 -
 76
76 -
 77
77 -
 78
78 -
 79
79 -
80
-
81
-
82
-
83
-
84
-
85
-
86
-
87
-
88
-
89
-
90
-
91
-
92
-
93
-
94
-
95
-
96
-
97
-
98
-
99
-
100
-
101
-
102
-
103
-
104
-
105
-
106
-
107
-
108
-
109
-
110
-
111
-
112
-
113
-
114
-
115
-
116
-
117
-
118
-
119
-
120
-
121
-
122
-
123
-
124
-
125
-
126
-
127
-
128
-
129
-
130
-
131
-
132
 |
 |

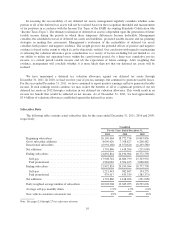
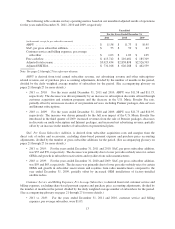
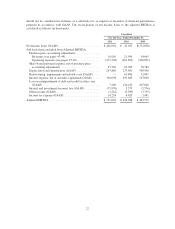
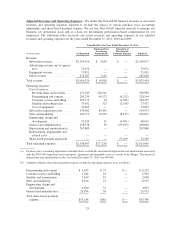
The following table contains our key operating metrics based on our unaudited adjusted results of operations
for the years ended December 31, 2011, 2010 and 2009, respectively:
Unaudited
For the Years Ended December 31,
2011 2010 2009
(in thousands, except for per subscriber amounts)
ARPU ......................................... $ 11.58 $ 11.73 $ 10.95
SAC, per gross subscriber addition ................... $ 55 $ 59 $ 63
Customer service and billing expenses, per average
subscriber .................................... $ 1.03 $ 1.03 $ 1.05
Free cash flow ................................... $ 415,742 $ 210,481 $ 185,319
Adjusted total revenue ............................. $3,025,434 $2,838,898 $2,526,703
Adjusted EBITDA ................................ $ 731,018 $ 626,288 $ 462,539
Note: See pages 21 through 27 for a glossary of terms.
ARPU is derived from total earned subscriber revenue, net advertising revenue and other subscription-
related revenue, net of purchase price accounting adjustments, divided by the number of months in the period,
divided by the daily weighted average number of subscribers for the period. (See accompanying glossary on
pages 21 through 27 for more details.)
•2011 vs. 2010: For the years ended December 31, 2011 and 2010, ARPU was $11.58 and $11.73,
respectively. The decrease was driven primarily by an increase in subscription discounts offered through
customer acquisition and retention programs and the decrease in the U.S. Music Royalty Fee rate,
partially offset by an increase in sales of our premium services, including Premier packages, data services
and Internet subscriptions.
•2010 vs. 2009: For the years ended December 31, 2010 and 2009, ARPU was $11.73 and $10.95,
respectively. The increase was driven primarily by the full year impact of the U.S. Music Royalty Fee
introduced in the third quarter of 2009, increased revenues from the sale of Premier packages, decreases
in discounts on multi-subscription and Internet packages, and increased net advertising revenue, partially
offset by an increase in the number of subscribers on promotional plans.
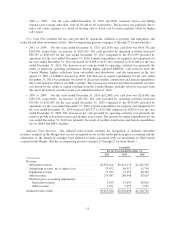
SAC, Per Gross Subscriber Addition, is derived from subscriber acquisition costs and margins from the
direct sale of radios and accessories, excluding share-based payment expense and purchase price accounting
adjustments, divided by the number of gross subscriber additions for the period. (See accompanying glossary on
pages 21 through 27 for more details.)
•2011 vs. 2010: For the years ended December 31, 2011 and 2010, SAC, per gross subscriber addition,
was $55 and $59, respectively. The decrease was primarily due to lower per radio subsidy rates for certain
OEMs and growth in subscriber reactivations and royalties from radio manufacturers.
•2010 vs. 2009: For the years ended December 31, 2010 and 2009, SAC, per gross subscriber addition,
was $59 and $63, respectively. The decrease was primarily due to lower per radio subsidy rates for certain
OEMs and growth in subscriber reactivations and royalties from radio manufacturers compared to the
year ended December 31, 2009, partially offset by increased OEM installations of factory-installed
satellite radios.
Customer Service and Billing Expenses, Per Average Subscriber, is derived from total customer service and
billing expenses, excluding share-based payment expense and purchase price accounting adjustments, divided by
the number of months in the period, divided by the daily weighted average number of subscribers for the period.
(See accompanying glossary on pages 21 through 27 for more details.)
•2011 vs. 2010: For the years ended December 31, 2011 and 2010, customer service and billing
expenses, per average subscriber, were $1.03.
13