XM Radio 2011 Annual Report Download - page 66
Download and view the complete annual report
Please find page 66 of the 2011 XM Radio annual report below. You can navigate through the pages in the report by either clicking on the pages listed below, or by using the keyword search tool below to find specific information within the annual report.-
 1
1 -
2
-
3
-
4
-
5
-
6
-
7
-
8
-
9
-
10
-
11
-
12
-
13
-
14
-
15
-
16
-
17
-
18
-
19
-
20
-
21
-
22
-
23
-
24
-
25
-
26
-
27
-
28
-
29
-
30
-
31
-
32
-
33
-
34
-
35
-
36
-
37
-
38
-
39
-
40
-
41
-
42
-
43
-
44
-
45
-
46
-
47
-
48
-
49
-
50
-
51
-
52
-
53
-
54
-
55
-
 56
56 -
 57
57 -
 58
58 -
 59
59 -
 60
60 -
 61
61 -
 62
62 -
 63
63 -
 64
64 -
 65
65 -
 66
66 -
 67
67 -
 68
68 -
 69
69 -
 70
70 -
 71
71 -
 72
72 -
 73
73 -
 74
74 -
 75
75 -
 76
76 -
77
-
78
-
79
-
80
-
81
-
82
-
83
-
84
-
85
-
86
-
87
-
88
-
89
-
90
-
91
-
92
-
93
-
94
-
95
-
96
-
97
-
98
-
99
-
100
-
101
-
102
-
103
-
104
-
105
-
106
-
107
-
108
-
109
-
110
-
111
-
112
-
113
-
114
-
115
-
116
-
117
-
118
-
119
-
120
-
121
-
122
-
123
-
124
-
125
-
126
-
127
-
128
-
129
-
130
-
131
-
132
 |
 |

In assessing the recoverability of our deferred tax assets, management regularly considers whether some
portion or all of the deferred tax assets will not be realized based on the recognition threshold and measurement
of tax positions in accordance with the Income Tax Topic of the FASB Accounting Standards Codification (the
“Income Taxes Topic”). The ultimate realization of deferred tax assets is dependent upon the generation of future
taxable income during the periods in which those temporary differences become deductible. Management
considers the scheduled reversal of deferred tax assets and liabilities, projected taxable income and tax planning
strategies in making this assessment. Management’s evaluation of the realizability of deferred tax assets
considers both positive and negative evidence. The weight given to the potential effects of positive and negative
evidence is based on the extent to which it can be objectively verified. Our conclusion with regard to maintaining
or releasing the valuation allowance gives consideration to a variety of factors including but not limited to: (a)
our ability to utilize net operating losses within the carryforward period, (b) a three-year cumulative pre-tax
income, (c) current period taxable income and (d) the expectation of future earnings. After weighting this
evidence, management will conclude whether it is more likely than not that our deferred tax assets will be
realized.
We have maintained a deferred tax valuation allowance against our deferred tax assets through
December 31, 2011. In 2010, we had our first year of pre-tax earnings, but continued to generate taxable losses.
For the year ended December 31, 2011, we have continued to report positive earnings and have generated taxable
income. If such earnings trends continue, we may realize the benefits of all or a significant portion of our net
deferred tax assets in 2012 through a reduction in our deferred tax valuation allowance. This would result in an
income tax benefit that would be reflected in net income. As of December 31, 2011, we had approximately
$3.4 billion of valuation allowances established against the deferred tax assets.
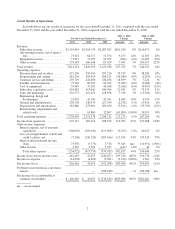
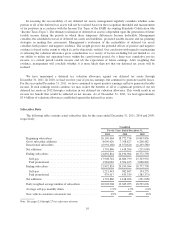
Subscriber Data
The following table contains actual subscriber data for the years ended December 31, 2011, 2010 and 2009,
respectively.
Unaudited
For the Years Ended December 31,
2011 2010 2009
Beginning subscribers .............................. 20,190,964 18,772,758 19,003,856
Gross subscriber additions ........................... 8,696,020 7,768,827 6,208,482
Deactivated subscribers ............................. (6,994,160) (6,350,621) (6,439,580)
Net additions ...................................... 1,701,860 1,418,206 (231,098)
Ending subscribers ................................. 21,892,824 20,190,964 18,772,758
Self-pay ....................................... 17,908,742 16,686,799 15,703,932
Paid promotional ................................ 3,984,082 3,504,165 3,068,826
Ending subscribers ................................. 21,892,824 20,190,964 18,772,758
Self-pay ....................................... 1,221,943 982,867 154,275
Paid promotional ................................ 479,917 435,339 (385,373)
Net additions ...................................... 1,701,860 1,418,206 (231,098)
Daily weighted average number of subscribers ........... 20,903,908 19,385,055 18,529,696
Average self-pay monthly churn ...................... 1.9% 1.9% 2.0%
New vehicle consumer conversion rate ................. 45% 46% 45%
Note: See pages 21 through 27 for a glossary of terms.
10