XM Radio 2011 Annual Report Download - page 127
Download and view the complete annual report
Please find page 127 of the 2011 XM Radio annual report below. You can navigate through the pages in the report by either clicking on the pages listed below, or by using the keyword search tool below to find specific information within the annual report.-
 1
1 -
2
-
3
-
4
-
5
-
6
-
7
-
8
-
9
-
10
-
11
-
12
-
13
-
14
-
15
-
16
-
17
-
18
-
19
-
20
-
21
-
22
-
23
-
24
-
25
-
26
-
27
-
28
-
29
-
30
-
31
-
32
-
33
-
34
-
35
-
36
-
37
-
38
-
39
-
40
-
41
-
42
-
43
-
44
-
45
-
46
-
47
-
48
-
49
-
50
-
51
-
52
-
53
-
54
-
55
-
56
-
57
-
58
-
59
-
60
-
61
-
62
-
63
-
64
-
65
-
66
-
67
-
68
-
69
-
70
-
71
-
72
-
73
-
74
-
75
-
76
-
77
-
78
-
79
-
80
-
81
-
82
-
83
-
84
-
85
-
86
-
87
-
88
-
89
-
90
-
91
-
92
-
93
-
94
-
95
-
96
-
97
-
98
-
99
-
100
-
101
-
102
-
103
-
104
-
105
-
106
-
107
-
108
-
109
-
110
-
111
-
112
-
113
-
114
-
115
-
116
-
 117
117 -
 118
118 -
 119
119 -
 120
120 -
 121
121 -
 122
122 -
 123
123 -
 124
124 -
 125
125 -
 126
126 -
 127
127 -
 128
128 -
 129
129 -
 130
130 -
 131
131 -
 132
132
 |
 |

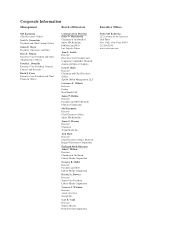
SIRIUS XM RADIO INC. AND SUBSIDIARIES
NOTES TO CONSOLIDATED FINANCIAL STATEMENTS — (Continued)
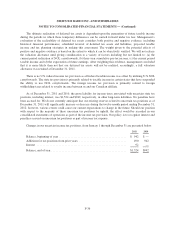
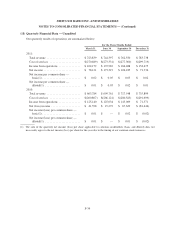
(18) Quarterly Financial Data — Unaudited
Our quarterly results of operations are summarized below:
For the Three Months Ended
March 31 June 30 September 30 December 31
2011:
Total revenue ....................... $723,839 $ 744,397 $ 762,550 $ 783,738
Cost of services ..................... $(270,689) $(273,331) $(277,360) $(299,719)
Income from operations ............... $164,172 $ 172,982 $ 184,488 $ 154,475
Net income ......................... $ 78,121 $ 173,319 $ 104,185 $ 71,336
Net income per common share —
basic(1) .......................... $ 0.02 $ 0.05 $ 0.03 $ 0.02
Net income per common share —
diluted(1) ........................ $ 0.01 $ 0.03 $ 0.02 $ 0.01
2010:
Total revenue ....................... $663,784 $ 699,761 $ 717,548 $ 735,899
Cost of services ..................... $(260,867) $(266,121) $(280,545) $(291,699)
Income from operations ............... $125,140 $ 125,634 $ 143,069 $ 71,571
Net (loss) income .................... $ 41,598 $ 15,272 $ 67,629 $ (81,444)
Net income (loss) per common share —
basic(1) .......................... $ 0.01 $ — $ 0.02 $ (0.02)
Net income (loss) per common share —
diluted(1) ........................ $ 0.01 $ — $ 0.01 $ (0.02)
(1) The sum of the quarterly net income (loss) per share applicable to common stockholders (basic and diluted) does not
necessarily agree to the net income (loss) per share for the year due to the timing of our common stock issuances.
F-39