Westjet 2011 Annual Report Download - page 91
Download and view the complete annual report
Please find page 91 of the 2011 Westjet annual report below. You can navigate through the pages in the report by either clicking on the pages listed below, or by using the keyword search tool below to find specific information within the annual report.-
 1
1 -
2
-
3
-
4
-
5
-
6
-
7
-
8
-
9
-
10
-
11
-
12
-
13
-
14
-
15
-
16
-
17
-
18
-
19
-
20
-
21
-
22
-
23
-
24
-
25
-
26
-
27
-
28
-
29
-
30
-
31
-
32
-
33
-
34
-
35
-
36
-
37
-
38
-
39
-
40
-
41
-
42
-
43
-
44
-
45
-
46
-
47
-
48
-
49
-
50
-
51
-
52
-
53
-
54
-
55
-
56
-
57
-
58
-
59
-
60
-
61
-
62
-
63
-
64
-
65
-
66
-
67
-
68
-
69
-
70
-
71
-
72
-
73
-
74
-
75
-
76
-
77
-
78
-
79
-
80
-
 81
81 -
 82
82 -
 83
83 -
 84
84 -
 85
85 -
 86
86 -
 87
87 -
 88
88 -
 89
89 -
 90
90 -
 91
91 -
 92
92 -
 93
93 -
 94
94 -
 95
95 -
 96
96 -
 97
97 -
 98
98 -
 99
99 -
 100
100 -
 101
101 -
102
-
103
-
104
-
105
-
106
-
107
-
108
-
109
-
110
-
111
 |
 |

Notes to Consolidated Financial Statements
For the years ended December 31, 2011 and 2010
(Stated in thousands of Canadian dollars, except share and per share amounts)
│
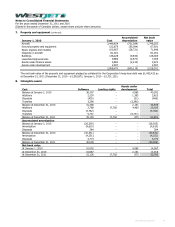
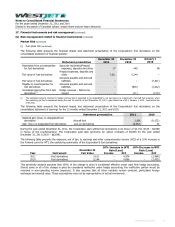
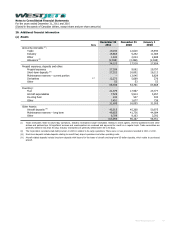
17. Financial instruments and risk management
(a) Fair value of financial assets and financial liabilities
The Corporation’s financial assets and liabilities consist primarily of cash and cash equivalents, accounts receivable, derivatives
both designated and not designated in an effective hedging relationship, deposits, accounts payable and accrued liabilities, long-
term debt and obligations under finance leases. The following tables set out the Corporation’s classification and carrying amount,
together with the fair value, for each type of financial asset and financial liability as at December 31, 2011 and 2010, and
January 1, 2010:
Fair value Amortized cost Totals
December 31, 2011 Through profit
or loss Derivatives
Loans and
receivables
Other financial
liabilities
Carrying
amount
Fair
value
Asset (liability):
Cash and cash equivalents (i) 1,291,946 – – – 1,291,946 1,291,946
Accounts receivable – – 34,122 – 34,122 34,122
Foreign exchange derivatives (ii) –4,662 – – 4,662 4,662
Fuel derivatives (iii) –7,611 – – 7,611 7,611
Interest rate derivatives (iv) – (532) – – (532) (532)
Deposits (v) 28,386 – – – 28,386 28,386
Accounts payable and accrued
liabilities (vi) – – – (284,902) (284,902) (284,902)
Long-term debt (vii) –– – (828,712) (828,712) (937,336)
Obligations under finance leases
(viii)
–– – (3,249) (3,249) (3,249)
1,320,332 11,741 34,122 (1,116,863) 249,332 140,708
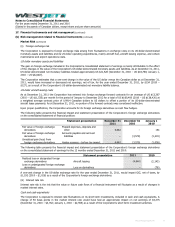
Fair value Amortized cost Totals
December 31, 2010 Through profit
or loss Derivatives
Loans and
receivables
Other financial
liabilities
Carrying
amount
Fair
value
Asset (liability):
Cash and cash equivalents (i) 1,187,899 – – – 1,187,899 1,187,899
Accounts receivable – – 17,518 – 17,518 17,518
Foreign exchange derivatives (ii) – (3,579) – – (3,579) (3,579)
Fuel derivatives (iii) – 4,889 – – 4,889 4,889
Deposits (v) 28,258 – – – 28,258 28,258
Accounts payable and accrued
liabilities (vi) – – – (264,136) (264,136) (264,136)
Long-term debt (vii) – – – (1,026,802) (1,026,802) (1,141,961)
Obligations under finance leases
(viii)
– – – (3,357) (3,357) (3,357)
1,216,157 1,310 17,518 (1,294,295) (59,310) (174,469)
WestJet Annual Report 2011 91