Westjet 2011 Annual Report Download - page 29
Download and view the complete annual report
Please find page 29 of the 2011 Westjet annual report below. You can navigate through the pages in the report by either clicking on the pages listed below, or by using the keyword search tool below to find specific information within the annual report.
Management’s Discussion and Analysis of Financial Results 2011
│
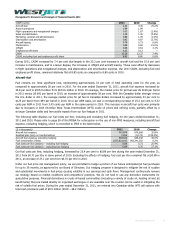
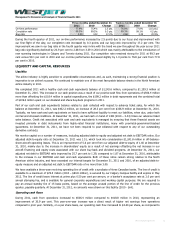
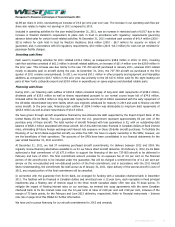
CASM (cents) 2011 2010 Change
Aircraft fuel 4.32 3.45 25.2%
Airport operations 1.99 1.99 ―
Flight operations and navigational charges 1.63 1.67 (2.4%)
Sales and distribution 1.29 1.30 (0.8%)
Marketing, general and administration 0.99 1.00 (1.0%)
Depreciation and amortization 0.82 0.87 (5.7%)
Aircraft leasing 0.78 0.73 6.8%
Maintenance 0.69 0.60 15.0%
Inflight 0.66 0.64 3.1%
Employee profit share 0.12 0.12 ―
CASM 13.29 12.37 7.4%
CASM, excluding fuel and employee profit share 8.85 8.80 0.6%
During 2011, CASM increased by 7.4 per cent due largely to the 25.2 per cent increase in aircraft fuel and the 15.0 per cent
increase in maintenance, and to a lesser degree, the increases in inflight and aircraft leasing. These were offset by decreases
in flight operations and navigational charges, and depreciation and amortization expense. Our 2011 CASM, excluding fuel and
employee profit share, remained relatively flat at 8.85 cents as compared to 8.80 cents in 2010.
Aircraft fuel
Fuel remains our most significant cost, representing approximately 33 per cent of total operating costs for the year, as
compared to approximately 28 per cent in 2010. For the year ended December 31, 2011, aircraft fuel expense increased by
35.8 per cent to $915.9 million from $674.6 million in 2010. On average, the market price for jet fuel was US $126 per barrel
in 2011 versus US $91 per barrel in 2010, an increase of approximately 38 per cent. With the Canadian dollar stronger versus
the U.S. dollar in 2011, the average market price for jet fuel in Canadian dollars increased by approximately 33 per cent to
$125 per barrel from $94 per barrel in 2010. On a per ASM basis, we saw a corresponding increase of 25.2 per cent to 4.32
cents per ASM in 2011 from 3.45 cents per ASM in the same period in 2010. This increase in aircraft fuel costs was primarily
due to increases in both US-dollar West Texas Intermediate (WTI) crude oil prices and refining costs, partially offset by a
stronger Canadian dollar and favourable impacts from our fuel hedges in 2011.
The following table displays our fuel costs per litre, including and excluding fuel hedging, for the years ended December 31,
2011 and 2010. Please refer to page 58 of this MD&A for a discussion on the use of non-IFRS measures, including aircraft fuel
expense, excluding hedging, which is reconciled to IFRS in the table below.
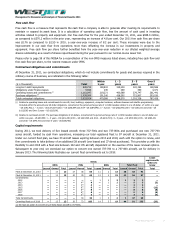
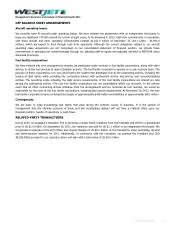
($ in thousands) 2011 2010 Change
Aircraft fuel expense 915,878 674,608 35.8%
Realized gain (loss) on fuel derivatives 2,656 (9,172) (129.0%)
Aircraft fuel expense, excluding hedging 918,534 665,436 38.0%
Fuel consumption (litres) 1,027,821,192 950,341,292 8.2%
Fuel costs per litre (dollars) – including fuel hedging 0.89 0.71 25.4%
Fuel costs per litre (dollars) – excluding fuel hedging 0.89 0.70 27.1%
Our fuel costs per litre, including hedging, increased by 25.4 per cent to $0.89 per litre during the year ended December 31,
2011 from $0.71 per litre in same period of 2010. Excluding the effects of hedging, fuel cost per litre remained flat at $0.89 in
2011, an increase of 27.1 per cent from $0.70 per litre in 2010.
Under our fuel price risk management policy, we are permitted to hedge a portion of our future anticipated jet fuel purchases
for up to 36 months, as approved by our Board of Directors. Our hedging program is designed to mitigate the risk of sudden
and substantial movements in fuel prices causing volatility in our earnings and cash flows. Management continuously reviews
our strategy based on market conditions and competitors’ positions. We do not hold or use any derivative instruments for
speculative purposes. Financial derivatives in crude-oil-based commodities (including a variety of crude oil, heating oil and jet
benchmarks) that are traded directly on organized exchanges or are available over the counter can be useful in mitigating the
risk of volatile fuel prices. During the year ended December 31, 2011, we entered into Canadian-dollar WTI call options with
total cash premiums paid of $8.5 million (2010 – $6.2 million).
WestJet Annual Report 2011 29


