Westjet 2011 Annual Report Download - page 23
Download and view the complete annual report
Please find page 23 of the 2011 Westjet annual report below. You can navigate through the pages in the report by either clicking on the pages listed below, or by using the keyword search tool below to find specific information within the annual report.-
 1
1 -
2
-
3
-
4
-
5
-
6
-
7
-
8
-
9
-
10
-
11
-
12
-
 13
13 -
 14
14 -
 15
15 -
 16
16 -
 17
17 -
 18
18 -
 19
19 -
 20
20 -
 21
21 -
 22
22 -
 23
23 -
 24
24 -
 25
25 -
 26
26 -
 27
27 -
 28
28 -
 29
29 -
 30
30 -
 31
31 -
 32
32 -
 33
33 -
34
-
35
-
36
-
37
-
38
-
39
-
40
-
41
-
42
-
43
-
44
-
45
-
46
-
47
-
48
-
49
-
50
-
51
-
52
-
53
-
54
-
55
-
56
-
57
-
58
-
59
-
60
-
61
-
62
-
63
-
64
-
65
-
66
-
67
-
68
-
69
-
70
-
71
-
72
-
73
-
74
-
75
-
76
-
77
-
78
-
79
-
80
-
81
-
82
-
83
-
84
-
85
-
86
-
87
-
88
-
89
-
90
-
91
-
92
-
93
-
94
-
95
-
96
-
97
-
98
-
99
-
100
-
101
-
102
-
103
-
104
-
105
-
106
-
107
-
108
-
109
-
110
-
111
 |
 |
Management’s Discussion and Analysis of Financial Results 2011
│
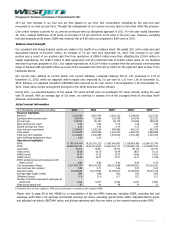
25.4 per cent increase in our fuel cost per litre (based on our 2011 fuel consumption multiplied by the year-over-year
movement in our fuel cost per litre). Through the management of our revenue we were able to more than offset this pressure.
Cost control remains a priority for us, and we continued with our disciplined approach in 2011. For the year ended December
31, 2011, realized CASM was 13.29 cents, an increase of 7.4 per cent from 12.37 cents in the prior year. However, excluding
fuel and employee profit share, CASM was relatively flat at 8.85 cents as compared to 8.80 cents in 2010.
Balance sheet strength
Our consistent and strong financial results are visible in the health of our balance sheet. We ended 2011 with a cash and cash
equivalents balance of $1,243.6 million, an increase of 7.2 per cent from December 31, 2010. The increase in our cash
position was a result of our positive cash flow from operations of $506.4 million more than offsetting the $118.4 million in
capital expenditures, the $199.2 million in debt repayments and the combined total of $109.6 million spent on our dividend
and share buy-back programs in 2011. Our capital expenditures of $118.4 million is greater than the previously communicated
range of between $95 and $105 million as result of the successful bid of US $17.6 million for the eight slot pairs at New York’s
LaGuardia airport.
Our current ratio, defined as current assets over current liabilities, remained relatively flat at 1.51 compared to 1.53 at
December 31, 2010, while our adjusted debt-to-equity ratio improved by 5.6 per cent to 1.51 from 1.60 at December 31,
2010. Similarly, our adjusted net debt to EBITDAR ratio improved by 25.7 per cent to 1.39 compared to 1.87 at December 31,
2010. These ratios remain amongst the strongest in the North American airline industry.
During 2011, we assumed delivery of five leased 737 series aircraft and one purchased 737 series aircraft, ending the year
with 97 aircraft. With an average age of 5.8 years, we continue to operate one of the youngest fleets of any large North
American commercial airline.
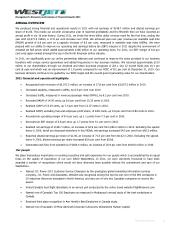
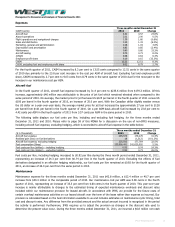
Select annual information
($ in thousands, except per unit data) 2011 2010 2009(i) 2008(i) 2007(i)
Financial highlights
Revenue 3,071,540 2,607,294 2,281,120 2,549,506 2,127,156
Earnings before income taxes 208,006 133,465 136,796 254,749 233,313
Net earnings 148,702 90,197 98,178 178,506 189,048
Basic earnings per share 1.06 0.62 0.74 1.39 1.46
Diluted earnings per share 1.06 0.62 0.74 1.37 1.44
Cash and cash equivalents 1,243,605 1,159,316 994,989 820,214 653,558
Total assets 3,473,678 3,383,980 3,493,702 3,268,702 2,969,899
Total long-term liabilities 1,161,604 1,240,285 1,051,912 1,201,382 1,257,634
Cash dividends declared per share 0.20 0.05 ― ― ―
Operational highlights
ASMs 21,186,304,409 19,535,291,313 17,587,640,902 17,138,883,465 14,544,737,340
RPMs 16,890,941,121 15,613,121,610 13,834,761,211 13,730,960,234 11,739,063,003
Load factor 79.7% 79.9% 78.7% 80.1% 80.7%
Yield (cents) 18.18 16.70 16.49 18.57 18.12
RASM (cents) 14.50 13.35 12.97 14.88 14.62
CASM (cents) 13.29 12.37 11.77 13.17 12.58
CASM, excluding fuel and employee profit
share (cents) 8.85 8.80 8.45 8.29 8.79
Fuel consumption (litres) 1,027,821,192 950,341,292 859,115,698 839,699,921 723,104,203
Fuel costs per litre (dollars) 0.89 0.71 0.66 0.97 0.70
Segment guests 16,040,682 15,173,581 14,038,827 14,283,630 13,004,726
Average stage length (miles) 984 968 923 913 856
Utilization (hours) 11.8 11.6 11.7 12.3 12.1
Number of full-time equivalent employees at
period end 7,141 6,877 6,291 6,187 5,682
Fleet size at period end
97 91 86 76 70
(i) Amounts have not been restated to IFRS and are presented in accordance with Canadian GAAP.
Please refer to page 59 of this MD&A for a reconciliation of the non-IFRS measures, including CASM, excluding fuel and
employee profit share; net earnings and diluted earnings per share, excluding special items; ROIC; adjusted debt-to-equity
and adjusted net debt to EBITDAR ratios; and diluted operating cash flow per share, to the nearest measure under IFRS.
WestJet Annual Report 2011 23