Westjet 2011 Annual Report Download - page 34
Download and view the complete annual report
Please find page 34 of the 2011 Westjet annual report below. You can navigate through the pages in the report by either clicking on the pages listed below, or by using the keyword search tool below to find specific information within the annual report.-
 1
1 -
2
-
3
-
4
-
5
-
6
-
7
-
8
-
9
-
10
-
11
-
12
-
13
-
14
-
15
-
16
-
17
-
18
-
19
-
20
-
21
-
22
-
23
-
 24
24 -
 25
25 -
 26
26 -
 27
27 -
 28
28 -
 29
29 -
 30
30 -
 31
31 -
 32
32 -
 33
33 -
 34
34 -
 35
35 -
 36
36 -
 37
37 -
 38
38 -
 39
39 -
 40
40 -
 41
41 -
 42
42 -
 43
43 -
 44
44 -
45
-
46
-
47
-
48
-
49
-
50
-
51
-
52
-
53
-
54
-
55
-
56
-
57
-
58
-
59
-
60
-
61
-
62
-
63
-
64
-
65
-
66
-
67
-
68
-
69
-
70
-
71
-
72
-
73
-
74
-
75
-
76
-
77
-
78
-
79
-
80
-
81
-
82
-
83
-
84
-
85
-
86
-
87
-
88
-
89
-
90
-
91
-
92
-
93
-
94
-
95
-
96
-
97
-
98
-
99
-
100
-
101
-
102
-
103
-
104
-
105
-
106
-
107
-
108
-
109
-
110
-
111
 |
 |

Management’s Discussion and Analysis of Financial Results 2011
│
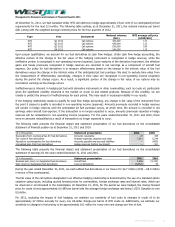
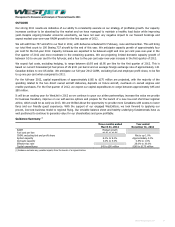
Three months ended December 31 Twelve months ended December 31
2011 2010 Change 2011 2010 Change
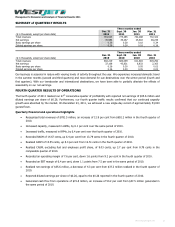
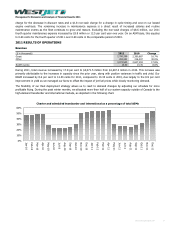
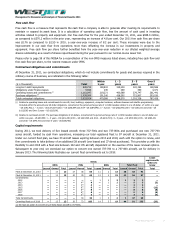
On-time performance 77.9% 75.4% 2.5 pts. 76.8% 77.8% (1.0 pts.)
Completion rate 99.5% 99.2% 0.3 pts. 99.3% 99.1% 0.2 pts.
Bag ratio 2.50 3.02 17.2% 2.68 3.39 20.9%
During the fourth quarter of 2011, our on-time performance increased by 2.5 points due to our focus and improvement with
our first flight of the day; our completion rate increased by 0.3 points and our bag ratio improved by 17.2 per cent. The
improvement we saw in our bag ratio in the fourth quarter was in-line with the trend we saw throughout the year as our 2011
bag ratio significantly declined by 20.9 per cent to 2.68 from 3.39 in 2010 which was mainly attributable to the introduction of
new scanning technologies in Calgary and Toronto during 2011. Our completion rate remained strong for 2011 at 99.3 per
cent versus 99.1 per cent in 2010 and our on-time performance decreased slightly by 1.0 points to 76.8 per cent from 77.8
per cent in 2010.
LIQUIDITY AND CAPITAL RESOURCES
Liquidity
The airline industry is highly sensitive to unpredictable circumstances and, as such, maintaining a strong financial position is
imperative to an airline’s success. We continued to maintain one of the most favourable balance sheets in the North American
airline industry in 2011.
We completed 2011 with a healthy cash and cash equivalents balance of $1,243.6 million, compared to $1,159.3 million at
December 31, 2010. This increase in our cash position was a result of our positive cash flow from operations of $506.4 million
more than offsetting the $118.4 million in capital expenditures, the $199.2 million in debt repayments and the combined total
of $109.6 million spent on our dividend and share buy-back programs in 2011.
Part of our cash and cash equivalents balance relates to cash collected with respect to advance ticket sales, for which the
balance at December 31, 2011, was $432.2 million, an increase of 28.3 per cent from $336.9 million at December 31, 2010.
Typically, we have cash and cash equivalents on hand to have sufficient liquidity to meet our liabilities, when due, under both
normal and stressed conditions. At December 31, 2011, we had cash on hand of 2.88 (2010 – 3.44) times our advance ticket
sales balance. Credit risk associated with cash and cash equivalents is managed by ensuring that these financial assets are
invested primarily in debt instruments from highly-rated financial institutions, many with provincial-government-backed
guarantees. At December 31, 2011, we have not been required to post collateral with respect to any of our outstanding
derivative contracts.
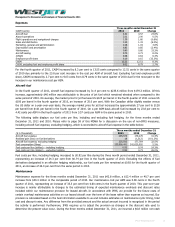
We monitor capital on a number of measures, including adjusted debt-to-equity and adjusted net debt to EBITDAR ratios. Our
adjusted debt-to-equity ratio at December 31, 2011 was 1.51, which took into consideration $1,241.8 million in off-balance-
sheet aircraft operating leases. This is an improvement of 5.6 per cent from our adjusted debt-to-equity of 1.60 at December
31, 2010, mainly due to the increase in shareholders’ equity as a result of net earnings offsetting the net increase in our
aircraft financing and equity costs associated with our share buy-back and dividend programs. At December 31, 2011, our
adjusted net debt to EBITDAR ratio improved by 25.7 per cent to 1.39, compared to 1.87 at December 31, 2010, attributable
to the increase in our EBITDAR and cash and cash equivalents. Both of these ratios remain strong relative to the North
American airline industry, and have exceeded our internal targets for December 31, 2011 and 2010, of an adjusted debt-to-
equity measure and an adjusted net debt to EBITDAR ratio of no more than 3.00.
We have available a three-year revolving operating line of credit with a syndicate of three Canadian banks. The line of credit is
available to a maximum of $76.5 million (2010 – $80.8 million), is secured by our Calgary Campus facility and expires in May
2012. The line of credit bears interest at prime plus 0.50 per cent per annum, or a banker’s acceptance rate at 2.0 per cent
annual stamping fee, and is available for general corporate expenditures and working capital purposes. We are required to
pay an annual standby fee of 15 basis points, based on the average unused portion of the line of credit for the previous
quarter, payable quarterly. At December 31, 2011, no amounts were drawn on this facility (2010 - $nil).
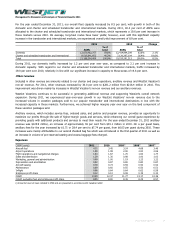
Operating cash flows
During 2011, cash from operations increased to $506.4 million compared to $418.8 million in 2010, representing an
improvement of 20.9 per cent. This year-over-year increase was a direct result of higher net earnings from operations
compared to prior year. Similarly, on a per share basis, our operating cash flow increased to $3.60 per share, as compared to
WestJet Annual Report 2011 34