Westjet 2011 Annual Report Download - page 59
Download and view the complete annual report
Please find page 59 of the 2011 Westjet annual report below. You can navigate through the pages in the report by either clicking on the pages listed below, or by using the keyword search tool below to find specific information within the annual report.-
 1
1 -
2
-
3
-
4
-
5
-
6
-
7
-
8
-
9
-
10
-
11
-
12
-
13
-
14
-
15
-
16
-
17
-
18
-
19
-
20
-
21
-
22
-
23
-
24
-
25
-
26
-
27
-
28
-
29
-
30
-
31
-
32
-
33
-
34
-
35
-
36
-
37
-
38
-
39
-
40
-
41
-
42
-
43
-
44
-
45
-
46
-
47
-
48
-
 49
49 -
 50
50 -
 51
51 -
 52
52 -
 53
53 -
 54
54 -
 55
55 -
 56
56 -
 57
57 -
 58
58 -
 59
59 -
 60
60 -
 61
61 -
 62
62 -
 63
63 -
 64
64 -
 65
65 -
 66
66 -
 67
67 -
 68
68 -
 69
69 -
70
-
71
-
72
-
73
-
74
-
75
-
76
-
77
-
78
-
79
-
80
-
81
-
82
-
83
-
84
-
85
-
86
-
87
-
88
-
89
-
90
-
91
-
92
-
93
-
94
-
95
-
96
-
97
-
98
-
99
-
100
-
101
-
102
-
103
-
104
-
105
-
106
-
107
-
108
-
109
-
110
-
111
 |
 |

Management’s Discussion and Analysis of Financial Results 2011
│
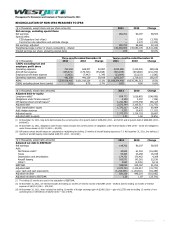
RECONCILIATION OF NON-IFRS MEASURES TO IFRS
($ in thousands, except share and per share amounts) 2011 2010 Change
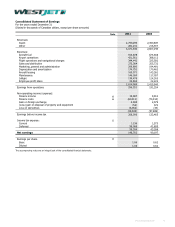
Net earnings, excluding special items
Net earnings 148,702 90,197 58,505
Special items:
CEO departure (net of tax) ― 3,700 (3,700)
Income tax rate reductions and estimate change ― 2,372 (2,372)
Net earnings, adjusted 148,702 96,269 52,433
Weighted average number of shares outstanding - diluted 140,638,659 145,080,105 (4,441,446)
Diluted earnings per share, excluding special items 1.06 0.66 60.6%
Three months ended December 31 Twelve months ended December 31
($ in thousands) 2011 2010 Change 2011 2010 Change
CASM, excluding fuel and
employee profit share
Operating expenses 722,294 628,307 93,987 2,814,989 2,415,940 399,049
Aircraft fuel expense (235,574) (179,726) (55,848) (915,878) (674,608) (241,270)
Employee profit share expense (5,662) (7,442) 1,780 (23,804) (22,222) (1,582)
Operating expenses, adjusted 481,058 441,139 39,919 1,875,307 1,719,110 156,197
ASMs 5,328,928,405 5,021,010,134 6.1% 21,186,304,409 19,535,291,313 8.5%
CASM, excluding above items (cents) 9.03 8.79 2.7% 8.85 8.80 0.6%
($ in thousands, except ratio amounts) 2011 2010 Change
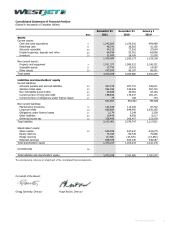
Adjusted debt-to-equity
Long-term debt(i) 828,712 1,026,802 (198,090)
Obligations under finance leases(ii) 3,249 3,357 (108)
Off-balance-sheet aircraft leases(iii) 1,241,783 1,075,358 166,425
Adjusted debt 2,073,744 2,105,517 (31,773)
Total shareholders’ equity 1,370,217 1,304,233 65,984
Add: Hedge reserves 3,353 10,470 (7,117)
Adjusted equity 1,373,570 1,314,703 58,867
Adjusted debt-to-equity 1.51 1.60 (5.6%)
(i) At December 31, 2011, long-term debt includes the current portion of long-term debt of $158,832 (2010 – $178,337) and long-term debt of $669,880 (2010 –
$848,465).
(ii) At December 31, 2011, obligations under finance leases includes the current portion of obligations under finance leases of $75 (2010 – $108) and obligations
under finance leases of $3,174 (2010 – $3,249).
(iii) Off-balance-sheet aircraft leases are calculated by multiplying the trailing 12 months of aircraft leasing expense by 7.5. At December 31, 2011, the trailing 12
months of aircraft leasing costs totalled $165,571 (2010 – $143,381).
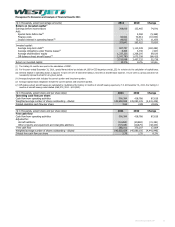
($ in thousands, except ratio amounts) 2011 2010 Change
Adjusted net debt to EBITDAR(i)
Net earnings 148,702 90,197 58,505
Add:
Net finance costs(ii) 44,924 61,004 (16,080)
Taxes 59,304 43,268 16,036
Depreciation and amortization 174,751 170,462 4,289
Aircraft leasing 165,571 143,381 22,190
Other(iii) 3,567 (2,545) 6,112
EBITDAR 596,819 505,767 91,052
Adjusted debt 2,073,744 2,105,517 (31,773)
Less: Cash and cash equivalents (1,243,605) (1,159,316) (84,289)
Adjusted net debt 830,139 946,201 (116,062)
Adjusted net debt to EBITDAR 1.39 1.87 (25.7%)
(i) The trailing 12 months are used in the calculation of EBITDAR.
(ii) At December 31, 2011, net interest includes the trailing 12 months of interest income of $15,987 (2010 – $9,910) and the trailing 12 months of interest
expense of $60,911 (2010 – $70,914).
(iii) At December 31, 2011, other includes the trailing 12 months of foreign exchange gain of $2,485 (2010 – gain of $2,579) and the trailing 12 months of non-
operating loss on derivatives of $6,052 (2010 – loss of $34).
WestJet Annual Report 2011 59