Westjet 2011 Annual Report Download - page 6
Download and view the complete annual report
Please find page 6 of the 2011 Westjet annual report below. You can navigate through the pages in the report by either clicking on the pages listed below, or by using the keyword search tool below to find specific information within the annual report.-
 1
1 -
 2
2 -
 3
3 -
 4
4 -
 5
5 -
 6
6 -
 7
7 -
 8
8 -
 9
9 -
 10
10 -
 11
11 -
 12
12 -
 13
13 -
 14
14 -
 15
15 -
 16
16 -
 17
17 -
18
-
19
-
20
-
21
-
22
-
23
-
24
-
25
-
26
-
27
-
28
-
29
-
30
-
31
-
32
-
33
-
34
-
35
-
36
-
37
-
38
-
39
-
40
-
41
-
42
-
43
-
44
-
45
-
46
-
47
-
48
-
49
-
50
-
51
-
52
-
53
-
54
-
55
-
56
-
57
-
58
-
59
-
60
-
61
-
62
-
63
-
64
-
65
-
66
-
67
-
68
-
69
-
70
-
71
-
72
-
73
-
74
-
75
-
76
-
77
-
78
-
79
-
80
-
81
-
82
-
83
-
84
-
85
-
86
-
87
-
88
-
89
-
90
-
91
-
92
-
93
-
94
-
95
-
96
-
97
-
98
-
99
-
100
-
101
-
102
-
103
-
104
-
105
-
106
-
107
-
108
-
109
-
110
-
111
 |
 |

Growing our business
WestJet Annual Report 2011 6
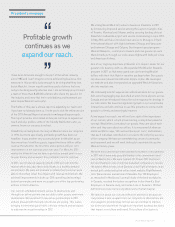
These numbers
tell our airline’s
successful
growth story.
“
“
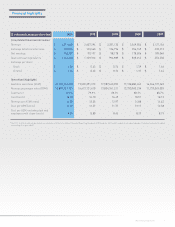
2007
Revenue*
(Millions of dollars)
2008 2009 2010 2011
2,127
2,550
2,281
2,607
3,072
2007
Available seat miles
(Millions)
2008 2009 2010 2011
14,545
17,139 17,588
19,535
21,186
2007
Segment guests
(Thousands)
2008 2009 2010 2011
13,005
14,284 14,039
15,174
16,041
*The 2011 & 2010 results are presented in accordance with the International Financial Reporting Standards (IFRS) and the 2009 results and prior are reported under Canadian GAAP.