Westjet 2011 Annual Report Download - page 110
Download and view the complete annual report
Please find page 110 of the 2011 Westjet annual report below. You can navigate through the pages in the report by either clicking on the pages listed below, or by using the keyword search tool below to find specific information within the annual report.-
 1
1 -
2
-
3
-
4
-
5
-
6
-
7
-
8
-
9
-
10
-
11
-
12
-
13
-
14
-
15
-
16
-
17
-
18
-
19
-
20
-
21
-
22
-
23
-
24
-
25
-
26
-
27
-
28
-
29
-
30
-
31
-
32
-
33
-
34
-
35
-
36
-
37
-
38
-
39
-
40
-
41
-
42
-
43
-
44
-
45
-
46
-
47
-
48
-
49
-
50
-
51
-
52
-
53
-
54
-
55
-
56
-
57
-
58
-
59
-
60
-
61
-
62
-
63
-
64
-
65
-
66
-
67
-
68
-
69
-
70
-
71
-
72
-
73
-
74
-
75
-
76
-
77
-
78
-
79
-
80
-
81
-
82
-
83
-
84
-
85
-
86
-
87
-
88
-
89
-
90
-
91
-
92
-
93
-
94
-
95
-
96
-
97
-
98
-
99
-
 100
100 -
 101
101 -
 102
102 -
 103
103 -
 104
104 -
 105
105 -
 106
106 -
 107
107 -
 108
108 -
 109
109 -
 110
110 -
 111
111
 |
 |

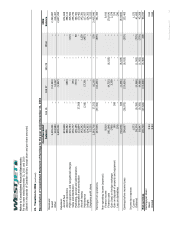
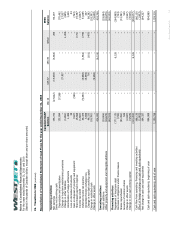
Notes to Consolidated Financial Statements
For the years ended December 31, 2011 and 2010
(Stated in thousands of Canadian dollars, except share and per share amounts)
│
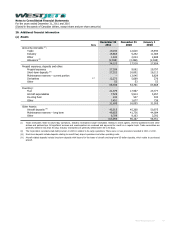
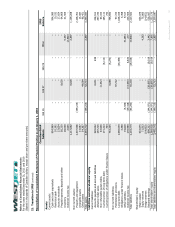
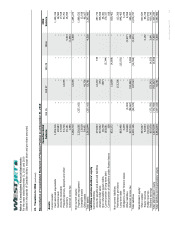
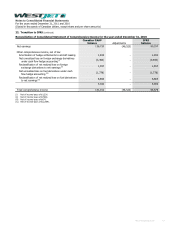
22. Transition to IFRS (continued)
Reconciliation of Consolidated Statement of Cash Flows for the year ended December 31, 2010
Canadian GAAP
balance IAS 16 IAS 37 IAS 39 Other
IFRS
balance
Operating activities:
Net earnin
g
s 136
,
720
(
27
,
622
)
(
14
,
638
)
(
4
,
463
)
200 90
,
197
Items not involving cash:
Depreciation and amortization 132,894 37,568 – – – 170,462
Change in long-term maintenance provisions – – 27,927 –
– 27,927
Change in other liabilities (1,891) – – –
1,206 (685)
Amortization of hedge settlements 1,400 – – –
– 1,400
Loss on derivative instruments 34 – – –
– 34
Gain on disposal of property and equipment (167) (596) – –
– (763)
Share-based payment expense 15,668 – – –
(171) 15,497
Income tax credit (1,667) – – –
– (1,667)
Deferred income tax expense 58,374 (9,350) (4,988) (1,562)
(779) 41,695
Unrealized foreign exchange loss 3,696 – (3,359) –
– 337
Chan
g
e in non-cash workin
g
ca
p
ital 98
,
222
–
716
(
101
)
(
455
)
98
,
382
Change in restricted cash (18,391) – – – – (18,391)
Change in other assets – – (5,658) –
– (5,658)
424,892 – – (6,126) – 418,766
Investing activities:
Aircraft additions (29,884) – – – – (29,884)
Other property and equipment and intangible additions (18,675) – – – – (18,675)
(48,559) – – – – (48,559)
Financing activities:
Repayment of long-term debt (171,115) – – 6,126 – (164,989)
Decrease in obligations under finance leases (744) – – –
– (744)
Shares repurchased (31,391) – – – – (31,391)
Issuance of common shares 520 – – –
– 520
Change in other assets (2,947) – – –
– (2,947)
Change in non-cash working capital (4,526) – – –
– (4,526)
(210,203) – – 6,126 – (204,077)
Cash flow from operating, financing and investing activities 166,130 – – – – 166,130
Effect of foreign exchange on cash and cash equivalents (1,803) – – –
– (1,803)
Net change in cash and cash equivalents 164,327 – – – – 164,327
Cash and cash equivalents, beginning of year 994,989 – – – – 994,989
Cash and cash equivalents, end of year 1,159,316 – – – – 1,159,316
WestJet Annual Report 2011 110