Westjet 2011 Annual Report Download - page 7
Download and view the complete annual report
Please find page 7 of the 2011 Westjet annual report below. You can navigate through the pages in the report by either clicking on the pages listed below, or by using the keyword search tool below to find specific information within the annual report.-
 1
1 -
 2
2 -
 3
3 -
 4
4 -
 5
5 -
 6
6 -
 7
7 -
 8
8 -
 9
9 -
 10
10 -
 11
11 -
 12
12 -
 13
13 -
 14
14 -
 15
15 -
 16
16 -
 17
17 -
 18
18 -
19
-
20
-
21
-
22
-
23
-
24
-
25
-
26
-
27
-
28
-
29
-
30
-
31
-
32
-
33
-
34
-
35
-
36
-
37
-
38
-
39
-
40
-
41
-
42
-
43
-
44
-
45
-
46
-
47
-
48
-
49
-
50
-
51
-
52
-
53
-
54
-
55
-
56
-
57
-
58
-
59
-
60
-
61
-
62
-
63
-
64
-
65
-
66
-
67
-
68
-
69
-
70
-
71
-
72
-
73
-
74
-
75
-
76
-
77
-
78
-
79
-
80
-
81
-
82
-
83
-
84
-
85
-
86
-
87
-
88
-
89
-
90
-
91
-
92
-
93
-
94
-
95
-
96
-
97
-
98
-
99
-
100
-
101
-
102
-
103
-
104
-
105
-
106
-
107
-
108
-
109
-
110
-
111
 |
 |

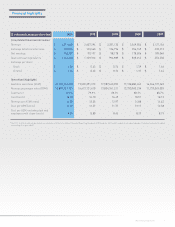
Financial highlights
Consolidated financial information
*
Revenue
Earnings before income taxes
Net earnings
Cash and cash equivalents
Earnings per share
Basic
Diluted
Operational highlights*
Available seat miles (ASM)
Revenue passenger miles (RPM)
Load factor
Yield (cents)
Revenue per ASM (cents)
Cost per ASM (cents)
Cost per ASM, excluding fuel and
employee profit share (cents)
3,071,540
208,006
148,702
1,243,605
1.06
1.06
21,186,304,409
16,890,941,121
79.7%
18.18
14.50
13.29
8.85
2,607,294
133,465
90,197
1,159,316
0.62
0.62
19,535,291,313
15,613,121,610
79.9%
16.70
13.35
12.37
8.80
2,281,120
136,796
98,178
994,989
0.74
0.74
17,587,640,902
13,834,761,211
78.7%
16.49
12.97
11.77
8.45
2,549,506
254,749
178,506
820,214
1.39
1.37
17,138,883,465
13,730,960,234
80.1%
18.57
14.88
13.17
8.29
2,127,156
233,313
189,048
653,558
1.46
1.44
14,544,737,340
11,739,063,003
80.7%
18.12
14.62
12.58
8.79
($ in thousands, except per share data)
2 011 2010 2009 2008 2007
$
$
$
$
$
$
$
$
$
$
$
$
$
$
$
$
$
$
$
$
$
$
$
$
$
$
$
$
$
$
WestJet Annual Report 2011 7
*The 2011 & 2010 results are presented in accordance with the International Financial Reporting Standards (IFRS) and the 2009 results and prior are reported under Canadian Generally Accepted
Accounting Principles GAAP.