Westjet 2011 Annual Report Download - page 27
Download and view the complete annual report
Please find page 27 of the 2011 Westjet annual report below. You can navigate through the pages in the report by either clicking on the pages listed below, or by using the keyword search tool below to find specific information within the annual report.-
 1
1 -
2
-
3
-
4
-
5
-
6
-
7
-
8
-
9
-
10
-
11
-
12
-
13
-
14
-
15
-
16
-
 17
17 -
 18
18 -
 19
19 -
 20
20 -
 21
21 -
 22
22 -
 23
23 -
 24
24 -
 25
25 -
 26
26 -
 27
27 -
 28
28 -
 29
29 -
 30
30 -
 31
31 -
 32
32 -
 33
33 -
 34
34 -
 35
35 -
 36
36 -
 37
37 -
38
-
39
-
40
-
41
-
42
-
43
-
44
-
45
-
46
-
47
-
48
-
49
-
50
-
51
-
52
-
53
-
54
-
55
-
56
-
57
-
58
-
59
-
60
-
61
-
62
-
63
-
64
-
65
-
66
-
67
-
68
-
69
-
70
-
71
-
72
-
73
-
74
-
75
-
76
-
77
-
78
-
79
-
80
-
81
-
82
-
83
-
84
-
85
-
86
-
87
-
88
-
89
-
90
-
91
-
92
-
93
-
94
-
95
-
96
-
97
-
98
-
99
-
100
-
101
-
102
-
103
-
104
-
105
-
106
-
107
-
108
-
109
-
110
-
111
 |
 |
Management’s Discussion and Analysis of Financial Results 2011
│
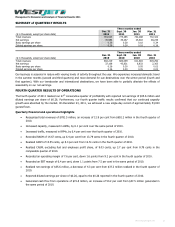
charge for the decrease in discount rates and a $1.8 non-cash charge for a change in cycle timing and cost on our leased
engine overhauls. The remaining increase in maintenance expense is a direct result of increased salaries and routine
maintenance events as the fleet continues to grow and mature. Excluding the non-cash charges of $8.6 million, our 2011
fourth quarter maintenance expense increased by $3.8 million or 12.5 per cent year over year. On an ASM basis, this equates
to 0.64 cents for the fourth quarter of 2011 over 0.60 cents in the comparable period of 2010.
2011 RESULTS OF OPERATIONS
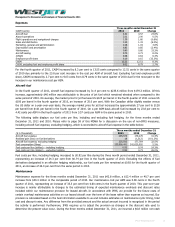
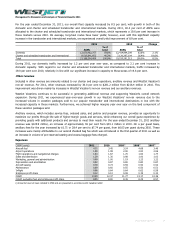
Revenue
($ in thousands) 2011 2010 Change
Guest 2,790,299 2,390,887 16.7%
Other 281,241 216,407 30.0%
3,071,540 2,607,294 17.8%
RASM (cents) 14.50 13.35 8.6%
During 2011, total revenue increased by 17.8 per cent to $3,071.5 million from $2,607.3 million in 2010. This increase was
primarily attributable to the increases in capacity since the prior year, along with positive variances in traffic and yield. Our
RASM increased by 8.6 per cent to 14.50 cents for 2011, compared to 13.35 cents in 2010, due largely to the 8.9 per cent
improvement in yield as we managed our fares to offset the impact of jet fuel prices while closely monitoring demand.
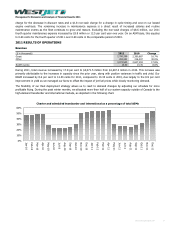
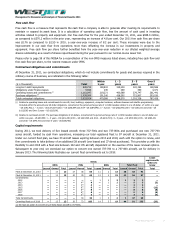
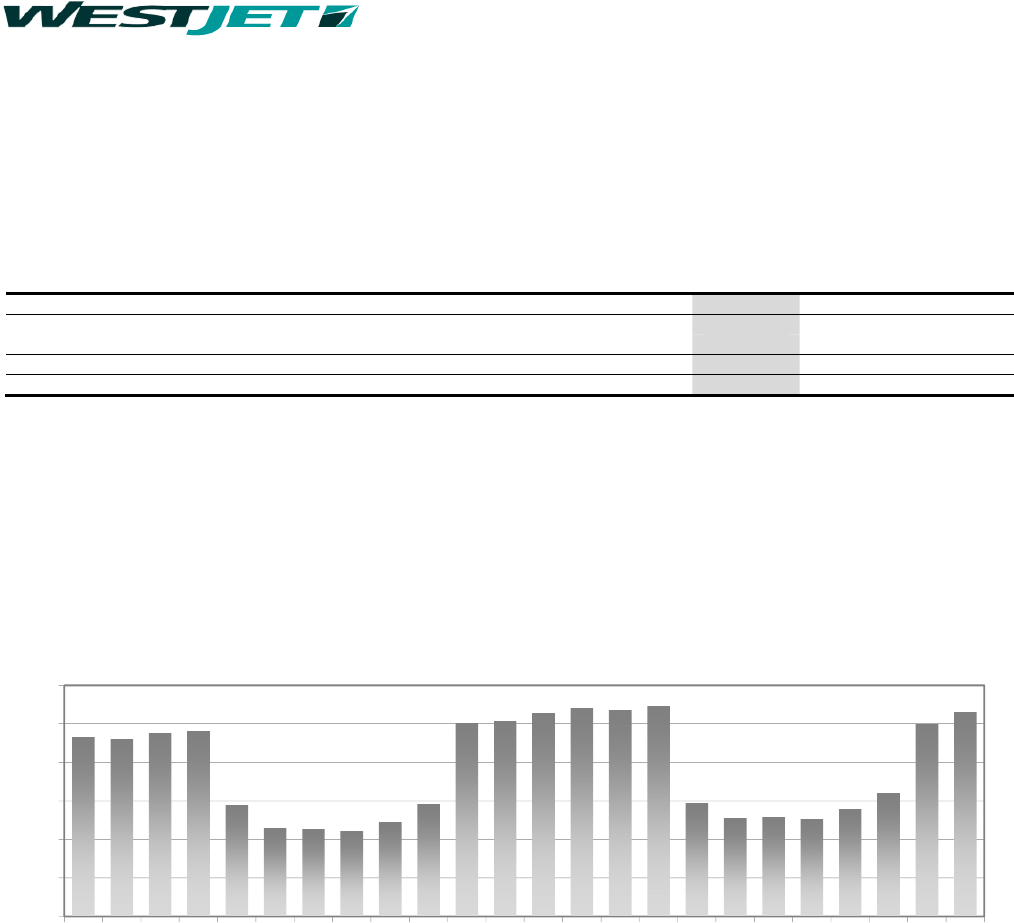
The flexibility of our fleet deployment strategy allows us to react to demand changes by adjusting our schedule for more
profitable flying. During the peak winter months, we allocated more than half of our system capacity outside of Canada to the
high-demand transborder and international markets, as depicted in the following chart.
0%
10%
20%
30%
40%
50%
60%
Jan-10
Feb-10
Mar-10
Apr-10
May-10
Jun-10
Jul-10
Aug-10
Sep-10
Oct-10
Nov-10
Dec-10
Jan-11
Feb-11
Mar-11
Apr-11
May-11
Jun-11
Jul-11
Aug-11
Sep-11
Oct-11
Nov-11
Dec-11
Charter and scheduled transborder and international as a percentage of total ASMs
WestJet Annual Report 2011 27