Wells Fargo 2010 Annual Report Download - page 81
Download and view the complete annual report
Please find page 81 of the 2010 Wells Fargo annual report below. You can navigate through the pages in the report by either clicking on the pages listed below, or by using the keyword search tool below to find specific information within the annual report.-
 1
1 -
2
-
3
-
4
-
5
-
6
-
7
-
8
-
9
-
10
-
11
-
12
-
13
-
14
-
15
-
16
-
17
-
18
-
19
-
20
-
21
-
22
-
23
-
24
-
25
-
26
-
27
-
28
-
29
-
30
-
31
-
32
-
33
-
34
-
35
-
36
-
37
-
38
-
39
-
40
-
41
-
42
-
43
-
44
-
45
-
46
-
47
-
48
-
49
-
50
-
51
-
52
-
53
-
54
-
55
-
56
-
57
-
58
-
59
-
60
-
61
-
62
-
63
-
64
-
65
-
66
-
67
-
68
-
69
-
70
-
 71
71 -
 72
72 -
 73
73 -
 74
74 -
 75
75 -
 76
76 -
 77
77 -
 78
78 -
 79
79 -
 80
80 -
 81
81 -
 82
82 -
 83
83 -
 84
84 -
 85
85 -
 86
86 -
 87
87 -
 88
88 -
 89
89 -
 90
90 -
 91
91 -
92
-
93
-
94
-
95
-
96
-
97
-
98
-
99
-
100
-
101
-
102
-
103
-
104
-
105
-
106
-
107
-
108
-
109
-
110
-
111
-
112
-
113
-
114
-
115
-
116
-
117
-
118
-
119
-
120
-
121
-
122
-
123
-
124
-
125
-
126
-
127
-
128
-
129
-
130
-
131
-
132
-
133
-
134
-
135
-
136
-
137
-
138
-
139
-
140
-
141
-
142
-
143
-
144
-
145
-
146
-
147
-
148
-
149
-
150
-
151
-
152
-
153
-
154
-
155
-
156
-
157
-
158
-
159
-
160
-
161
-
162
-
163
-
164
-
165
-
166
-
167
-
168
-
169
-
170
-
171
-
172
-
173
-
174
-
175
-
176
-
177
-
178
-
179
-
180
-
181
-
182
-
183
-
184
-
185
-
186
-
187
-
188
-
189
-
190
-
191
-
192
-
193
-
194
-
195
-
196
-
197
-
198
-
199
-
200
-
201
-
202
-
203
-
204
-
205
-
206
-
207
-
208
-
209
-
210
-
211
-
212
-
213
-
214
-
215
-
216
-
217
-
218
-
219
-
220
-
221
-
222
-
223
-
224
-
225
-
226
-
227
-
228
-
229
-
230
-
231
-
232
 |
 |

differences between financial instruments and markets, subject
to risk limits established and monitored by Corporate ALCO. All
securities, foreign exchange transactions, commodity
transactions and derivatives used in our trading businesses are
carried at fair value. The Institutional Risk Committee
establishes and monitors counterparty risk limits. The credit risk
amount and estimated net fair value of all customer
accommodation derivatives at December 31, 2010 and 2009 are
included in Note 15 (Derivatives) to Financial Statements in this
Report. Open, “at risk” positions for all trading businesses are
monitored by Corporate ALCO.
The standardized approach for monitoring and reporting
market risk for the trading activities consists of value-at-risk
(VaR) metrics complemented with factor analysis and stress
testing. VaR measures the worst expected loss over a given time
interval and within a given confidence interval. We measure and
report daily VaR at a 99% confidence interval based on actual
changes in rates and prices over the past 250 trading days. The
analysis captures all financial instruments that are considered
trading positions. The average one-day VaR throughout 2010
was $32 million, with a lower bound of $22 million and an upper
bound of $52 million. The average VaR for fourth quarter 2010
was $30 million, with a lower bound of $22 million and an upper
bound of $38 million.
MARKET RISK – EQUITY MARKETS We are directly and
indirectly affected by changes in the equity markets. We make
and manage direct equity investments in start-up businesses,
emerging growth companies, management buy-outs,
acquisitions and corporate recapitalizations. We also invest in
non-affiliated funds that make similar private equity
investments. These private equity investments are made within
capital allocations approved by management and the Board. The
Board’s policy is to review business developments, key risks and
historical returns for the private equity investment portfolio at
least annually. Management reviews the valuations of these
investments at least quarterly and assesses them for possible
OTTI. For nonmarketable investments, the analysis is based on
facts and circumstances of each individual investment and the
expectations for that investment’s cash flows and capital needs,
the viability of its business model and our exit strategy.
Nonmarketable investments include private equity investments
accounted for under the cost method and equity method. Private
equity investments are subject to OTTI. Principal investments
are carried at fair value with net unrealized gains and losses
reported in noninterest income.
As part of our business to support our customers, we trade
public equities, listed/OTC equity derivatives and convertible
bonds. We have risk mandates that govern these activities. We
also have marketable equity securities in the securities available-
for-sale portfolio, including securities relating to our venture
capital activities. We manage these investments within capital
risk limits approved by management and the Board and
monitored by Corporate ALCO. Gains and losses on these
securities are recognized in net income when realized and
periodically include OTTI charges.
Changes in equity market prices may also indirectly affect our
net income by affecting (1) the value of third party assets under
management and, hence, fee income, (2) particular borrowers,
whose ability to repay principal and/or interest may be affected
by the stock market, or (3) brokerage activity, related
commission income and other business activities. Each business
line monitors and manages these indirect risks.
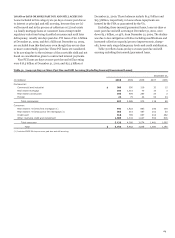
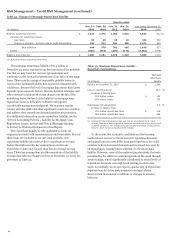
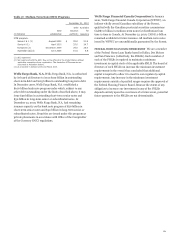
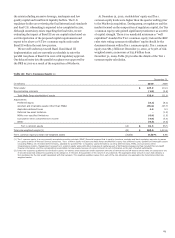
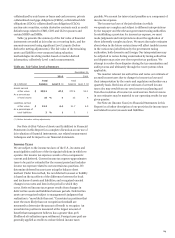
Table 36 provides information regarding our marketable and
nonmarketable equity investments.
Table 36: Marketable and Nonmarketable Equity Investments
December 31,
(in millions) 2010
2009
Nonmarketable equity investments:
Private equity investments:
Cost method $ 3,240
3,808
Equity method 7,624
5,138
Federal bank stock 5,254
5,985
Principal investments 305
1,423
Total nonmarketable
equity investments (1) $ 16,423
16,354
Marketable equity securities:
Cost $ 4,258
4,749
Net unrealized gains 931
843
Total marketable
equity securities (2) $ 5,189
5,592
(1)
Included in other assets on the balance sheet. See Note 7 (Premises, Equipment,
Lease Commitments and Other Assets) to Financial Statements in this Report for
additional information.
(2)
Included in securities available for sale. See Note 5 (Securities Available for Sale)
to Financial Statements in this Report for additional information.
79