Wells Fargo 2010 Annual Report Download - page 150
Download and view the complete annual report
Please find page 150 of the 2010 Wells Fargo annual report below. You can navigate through the pages in the report by either clicking on the pages listed below, or by using the keyword search tool below to find specific information within the annual report.-
 1
1 -
2
-
3
-
4
-
5
-
6
-
7
-
8
-
9
-
10
-
11
-
12
-
13
-
14
-
15
-
16
-
17
-
18
-
19
-
20
-
21
-
22
-
23
-
24
-
25
-
26
-
27
-
28
-
29
-
30
-
31
-
32
-
33
-
34
-
35
-
36
-
37
-
38
-
39
-
40
-
41
-
42
-
43
-
44
-
45
-
46
-
47
-
48
-
49
-
50
-
51
-
52
-
53
-
54
-
55
-
56
-
57
-
58
-
59
-
60
-
61
-
62
-
63
-
64
-
65
-
66
-
67
-
68
-
69
-
70
-
71
-
72
-
73
-
74
-
75
-
76
-
77
-
78
-
79
-
80
-
81
-
82
-
83
-
84
-
85
-
86
-
87
-
88
-
89
-
90
-
91
-
92
-
93
-
94
-
95
-
96
-
97
-
98
-
99
-
100
-
101
-
102
-
103
-
104
-
105
-
106
-
107
-
108
-
109
-
110
-
111
-
112
-
113
-
114
-
115
-
116
-
117
-
118
-
119
-
120
-
121
-
122
-
123
-
124
-
125
-
126
-
127
-
128
-
129
-
130
-
131
-
132
-
133
-
134
-
135
-
136
-
137
-
138
-
139
-
 140
140 -
 141
141 -
 142
142 -
 143
143 -
 144
144 -
 145
145 -
 146
146 -
 147
147 -
 148
148 -
 149
149 -
 150
150 -
 151
151 -
 152
152 -
 153
153 -
 154
154 -
 155
155 -
 156
156 -
 157
157 -
 158
158 -
 159
159 -
 160
160 -
161
-
162
-
163
-
164
-
165
-
166
-
167
-
168
-
169
-
170
-
171
-
172
-
173
-
174
-
175
-
176
-
177
-
178
-
179
-
180
-
181
-
182
-
183
-
184
-
185
-
186
-
187
-
188
-
189
-
190
-
191
-
192
-
193
-
194
-
195
-
196
-
197
-
198
-
199
-
200
-
201
-
202
-
203
-
204
-
205
-
206
-
207
-
208
-
209
-
210
-
211
-
212
-
213
-
214
-
215
-
216
-
217
-
218
-
219
-
220
-
221
-
222
-
223
-
224
-
225
-
226
-
227
-
228
-
229
-
230
-
231
-
232
 |
 |

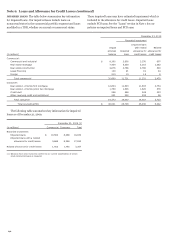
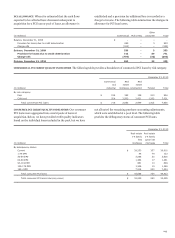
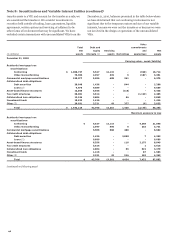
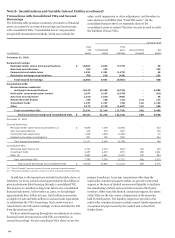
Note 8: Securitizations and Variable Interest Entities (continued)
transfer assets to a VIE and account for the transfer as a sale, we
are considered the transferor. We consider investments in
securities held outside of trading, loans, guarantees, liquidity
agreements, written options and servicing of collateral to be
other forms of involvement that may be significant. We have
excluded certain transactions with unconsolidated VIEs from the
December 31, 2010, balances presented in the table below where
we have determined that our continuing involvement is not
significant due to the temporary nature and size of our variable
interests, because we were not the transferor or because we were
not involved in the design or operations of the unconsolidated
VIEs.
Other
Total
Debt and
commitments
VIE
equity
Servicing
and
Net
(in millions)
assets
interests (1)
assets
Derivatives
guarantees
assets
December 31, 2010
Carrying value - asset (liability)
Residential mortgage loan
securitizations:
Conforming $ 1,068,737
5,527
12,115
-
(928)
16,714
Other/nonconforming 76,304
2,997
495
6
(107)
3,391
Commercial mortgage securitizations 190,377
5,506
608
261
-
6,375
Collateralized debt obligations:
Debt securities 20,046
1,436
-
844
-
2,280
Loans (2) 9,970
9,689
-
-
-
9,689
Asset-based finance structures 12,055
6,556
-
(118)
-
6,438
Tax credit structures 20,981
3,614
-
-
(1,129)
2,485
Collateralized loan obligations 13,196
2,804
-
56
-
2,860
Investment funds 10,522
1,416
-
-
-
1,416
Other (3) 20,031
3,221
43
377
(6)
3,635
Total $ 1,442,219
42,766
13,261
1,426
(2,170)
55,283
Maximum exposure to loss
Residential mortgage loan
securitizations:
Conforming $ 5,527
12,115
-
4,248
21,890
Other/nonconforming 2,997
495
6
233
3,731
Commercial mortgage securitizations 5,506
608
488
-
6,602
Collateralized debt obligations:
Debt securities 1,436
-
2,850
7
4,293
Loans (2) 9,689
-
-
-
9,689
Asset-based finance structures 6,556
-
118
2,175
8,849
Tax credit structures 3,614
-
-
1
3,615
Collateralized loan obligations 2,804
-
56
519
3,379
Investment funds 1,416
-
-
87
1,503
Other (3) 3,221
43
916
162
4,342
Total $ 42,766
13,261
4,434
7,432
67,893
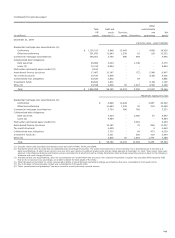
(continued on following page)
148