Wells Fargo 2010 Annual Report Download - page 47
Download and view the complete annual report
Please find page 47 of the 2010 Wells Fargo annual report below. You can navigate through the pages in the report by either clicking on the pages listed below, or by using the keyword search tool below to find specific information within the annual report.-
 1
1 -
2
-
3
-
4
-
5
-
6
-
7
-
8
-
9
-
10
-
11
-
12
-
13
-
14
-
15
-
16
-
17
-
18
-
19
-
20
-
21
-
22
-
23
-
24
-
25
-
26
-
27
-
28
-
29
-
30
-
31
-
32
-
33
-
34
-
35
-
36
-
 37
37 -
 38
38 -
 39
39 -
 40
40 -
 41
41 -
 42
42 -
 43
43 -
 44
44 -
 45
45 -
 46
46 -
 47
47 -
 48
48 -
 49
49 -
 50
50 -
 51
51 -
 52
52 -
 53
53 -
 54
54 -
 55
55 -
 56
56 -
 57
57 -
58
-
59
-
60
-
61
-
62
-
63
-
64
-
65
-
66
-
67
-
68
-
69
-
70
-
71
-
72
-
73
-
74
-
75
-
76
-
77
-
78
-
79
-
80
-
81
-
82
-
83
-
84
-
85
-
86
-
87
-
88
-
89
-
90
-
91
-
92
-
93
-
94
-
95
-
96
-
97
-
98
-
99
-
100
-
101
-
102
-
103
-
104
-
105
-
106
-
107
-
108
-
109
-
110
-
111
-
112
-
113
-
114
-
115
-
116
-
117
-
118
-
119
-
120
-
121
-
122
-
123
-
124
-
125
-
126
-
127
-
128
-
129
-
130
-
131
-
132
-
133
-
134
-
135
-
136
-
137
-
138
-
139
-
140
-
141
-
142
-
143
-
144
-
145
-
146
-
147
-
148
-
149
-
150
-
151
-
152
-
153
-
154
-
155
-
156
-
157
-
158
-
159
-
160
-
161
-
162
-
163
-
164
-
165
-
166
-
167
-
168
-
169
-
170
-
171
-
172
-
173
-
174
-
175
-
176
-
177
-
178
-
179
-
180
-
181
-
182
-
183
-
184
-
185
-
186
-
187
-
188
-
189
-
190
-
191
-
192
-
193
-
194
-
195
-
196
-
197
-
198
-
199
-
200
-
201
-
202
-
203
-
204
-
205
-
206
-
207
-
208
-
209
-
210
-
211
-
212
-
213
-
214
-
215
-
216
-
217
-
218
-
219
-
220
-
221
-
222
-
223
-
224
-
225
-
226
-
227
-
228
-
229
-
230
-
231
-
232
 |
 |

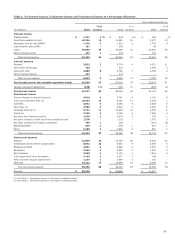
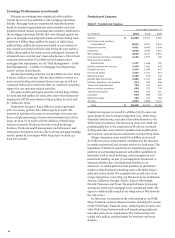
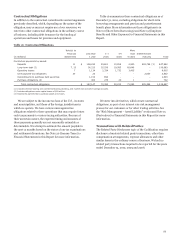
Noninterest Income
Table 7: Noninterest Income
Year ended December 31,
(in millions)
2010
2009
2008
Service charges on
deposit accounts $ 4,916
5,741
3,190
Trust and investment fees:
Tr us t , investment and IRA fees 4,038
3,588
2,161
Commissions and all other fees 6,896
6,147
763
Total trust and
investment fees 10,934
9,735
2,924
Card fees 3,652
3,683
2,336
Other fees:
Cash network fees 260
231
188
Charges and fees on loans 1,690
1,801
1,037
All other fees 2,040
1,772
872
Total other fees 3,990
3,804
2,097
Mortgage banking:
Servicing income, net 3,340
5,791
1,233
Net gains on mortgage loan
origination/sales activities 6,397
6,237
1,292
Total mortgage banking 9,737
12,028
2,525
Insurance 2,126
2,126
1,830
Net gains from trading activities 1,648
2,674
275
Net gains (losses) on debt
securities available for sale (324)
(127)
1,037
Net gains (losses) from
equity investments 779
185
(757)
Operating leases 815
685
427
All other 2,180
1,828
850
Total $ 40,453
42,362
16,734
Noninterest income of $40.5 billion represented 47% of revenue
for 2010 compared with $42.4 billion or, 48%, for 2009. The
decrease from 2009 was primarily the net result of an increase in
trust and investment fees to 13% of 2010 revenues from 11% for
2009, offset by the decrease in mortgage banking to 11% of 2010
revenues from 14% for 2009.
Our service charges on deposit accounts decreased in 2010 by
$825 million from 2009, although the deposit account portfolio
increased for the year. This decrease was related to regulatory
changes to debit card and ATM overdraft practices announced
by the Federal Reserve Board (FRB) in fourth quarter 2009. In
third quarter 2009, we also announced policy changes to help
customers limit overdraft and returned item fees. The
combination of these changes reduced our 2010 fee revenue by
approximately $810 million.
We earn trust, investment and IRA (Individual Retirement
Account) fees from managing and administering assets,
including mutual funds, corporate trust, personal trust,
employee benefit trust and agency assets. At December 31, 2010,
these assets totaled $2.1 trillion, up 11% from $1.9 trillion at
December 31, 2009. Trust, investment and IRA fees are largely
based on a tiered scale relative to the market value of the assets
under management or administration. The fees increased to
$4.0 billion in 2010 from $3.6 billion a year ago.
We receive commissions and other fees for providing services
to full-service and discount brokerage customers. These fees
increased to $6.9 billion in 2010 from $6.1 billion a year ago.
These fees include transactional commissions, which are based
on the number of transactions executed at the customer’s
direction, and asset-based fees, which are based on the market
value of the customer’s assets. Brokerage client assets totaled
$1.2 trillion at December 31, 2010, up 6% from a year ago.
Commissions and other fees also include fees from investment
banking activities including equity and bond underwriting.
Card fees were $3.7 billion in 2010, essentially flat from
2009. Legislative and regulatory changes enacted in 2010 caused
a reduction in card fee income, which was offset by growth in
purchase volume driven by improvements in the economy. The
effect of the Credit Card Accountability Responsibility and
Disclosure Act of 2009 (the Card Act) on card fees is fully
reflected in our 2010 results.
Mortgage banking noninterest income is generated by
servicing activities and loan origination/sales activities. This
income was $9.7 billion in 2010, compared with $12.0 billion for
2009. The reduction in mortgage banking noninterest income
was primarily driven by a $2.5 billion decline in net servicing
income, partially offset by a $160 million increase in net gains on
mortgage origination/sales.
Net servicing income includes both changes in the fair value
of mortgage servicing rights (MSRs) during the period as well as
changes in the value of derivatives (economic hedges) used to
hedge the MSRs. Net servicing income for 2010 included a
$1.5 billion net MSR valuation gain that was recorded to
earnings ($3.0 billion decrease in the fair value of the MSRs
offset by a $4.5 billion hedge gain) and for 2009 included a
$5.3 billion net MSR valuation gain ($1.5 billion decrease in the
fair value of MSRs offset by a $6.8 billion hedge gain). The
$3.8 billion decline in the net MSR valuation gain results for
2010 compared with 2009 was primarily due to a decline in
hedge carry income. See the “Risk Management – Mortgage
Banking Interest Rate and Market Risk” section of this Report
for a detailed discussion of our MSRs risks and hedging
approach. Our portfolio of loans serviced for others was
$1.84 trillion at December 31, 2010, and $1.88 trillion at
December 31, 2009. At December 31, 2010, the ratio of MSRs to
related loans serviced for others was 0.86%, compared with
0.91% at December 31, 2009.
Income from loan origination/sale activities was $6.4 billion
in 2010 compared with $6.2 billion for 2009. The slight increase
in 2010 was driven by higher margins on loan originations, offset
by lower loan origination volume and higher provision for loan
repurchase losses. Residential real estate originations were
$386 billion in 2010 compared with $420 billion a year ago and
mortgage applications were $620 billion in 2010 compared with
$651 billion in 2009. The 1-4 family first mortgage unclosed
pipeline was $73 billion at December 31, 2010, and $57 billion at
December 31, 2009. For additional detail, see the “Risk
Management – Mortgage Banking Interest Rate and Market
Risk” section and Note 1 (Summary of Significant Accounting
Policies), Note 9 (Mortgage Banking Activities) and Note 16 (Fair
Values of Assets and Liabilities) to Financial Statements in this
Report.
45