Wells Fargo 2010 Annual Report Download - page 48
Download and view the complete annual report
Please find page 48 of the 2010 Wells Fargo annual report below. You can navigate through the pages in the report by either clicking on the pages listed below, or by using the keyword search tool below to find specific information within the annual report.-
 1
1 -
2
-
3
-
4
-
5
-
6
-
7
-
8
-
9
-
10
-
11
-
12
-
13
-
14
-
15
-
16
-
17
-
18
-
19
-
20
-
21
-
22
-
23
-
24
-
25
-
26
-
27
-
28
-
29
-
30
-
31
-
32
-
33
-
34
-
35
-
36
-
37
-
 38
38 -
 39
39 -
 40
40 -
 41
41 -
 42
42 -
 43
43 -
 44
44 -
 45
45 -
 46
46 -
 47
47 -
 48
48 -
 49
49 -
 50
50 -
 51
51 -
 52
52 -
 53
53 -
 54
54 -
 55
55 -
 56
56 -
 57
57 -
 58
58 -
59
-
60
-
61
-
62
-
63
-
64
-
65
-
66
-
67
-
68
-
69
-
70
-
71
-
72
-
73
-
74
-
75
-
76
-
77
-
78
-
79
-
80
-
81
-
82
-
83
-
84
-
85
-
86
-
87
-
88
-
89
-
90
-
91
-
92
-
93
-
94
-
95
-
96
-
97
-
98
-
99
-
100
-
101
-
102
-
103
-
104
-
105
-
106
-
107
-
108
-
109
-
110
-
111
-
112
-
113
-
114
-
115
-
116
-
117
-
118
-
119
-
120
-
121
-
122
-
123
-
124
-
125
-
126
-
127
-
128
-
129
-
130
-
131
-
132
-
133
-
134
-
135
-
136
-
137
-
138
-
139
-
140
-
141
-
142
-
143
-
144
-
145
-
146
-
147
-
148
-
149
-
150
-
151
-
152
-
153
-
154
-
155
-
156
-
157
-
158
-
159
-
160
-
161
-
162
-
163
-
164
-
165
-
166
-
167
-
168
-
169
-
170
-
171
-
172
-
173
-
174
-
175
-
176
-
177
-
178
-
179
-
180
-
181
-
182
-
183
-
184
-
185
-
186
-
187
-
188
-
189
-
190
-
191
-
192
-
193
-
194
-
195
-
196
-
197
-
198
-
199
-
200
-
201
-
202
-
203
-
204
-
205
-
206
-
207
-
208
-
209
-
210
-
211
-
212
-
213
-
214
-
215
-
216
-
217
-
218
-
219
-
220
-
221
-
222
-
223
-
224
-
225
-
226
-
227
-
228
-
229
-
230
-
231
-
232
 |
 |

Earnings Performance (continued)
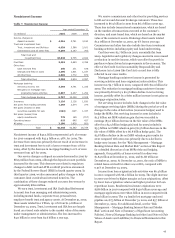
Net gains on mortgage loan origination/sales activities
include the cost of any additions to the mortgage repurchase
liability. Mortgage loans are repurchased from third parties
based on standard representations and warranties and early
payment default clauses in mortgage sale contracts. Additions to
the mortgage repurchase liability that were charged against net
gains on mortgage loan origination/sales activities during 2010
totaled $1.6 billion ($927 million for 2009), of which $144
million ($302 million for 2009) was related to our estimate of
loss content associated with loan sales during the year and $1.5
billion ($625 million for 2009) was for subsequent increases in
estimated losses on prior year’s loan sales because of the current
economic environment. For additional information about
mortgage loan repurchases, see the “Risk Management – Credit
Risk Management – Liability for Mortgage Loan Repurchase
Losses” section in this Report.
Income from trading activities was $1.6 billion in 2010, down
from $2.7 billion a year ago. This decrease reflects a return to a
more normal trading environment from a year ago as well as a
continued reduction in risk levels while we continue to prioritize
support for our customer-related activities.
Net gains on debt and equity securities totaled $455 million
for 2010 and $58 million for 2009, after other-than-temporary
impairment (OTTI) write-downs of $940 million for 2010 and
$1.7 billion for 2009.
Noninterest income of $42.4 billion in 2009 represented
48% of revenue, up from $16.7 billion (40%) in 2008. The
increase in noninterest income as a percentage of revenue was
due to a higher percentage of trust and investment fees (11% in
2009, up from 7% in 2008) with the addition of Wells Fargo
Advisors (formerly Wachovia Securities) retail brokerage
business, Wachovia wealth management and retirement, and
reinsurance businesses, and also due to strong mortgage banking
results, primarily from legacy Wells Fargo (14% in 2009, up
from 6% in 2008).
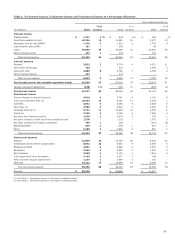
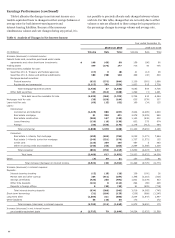
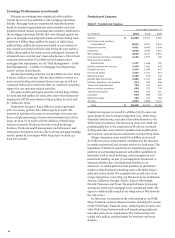
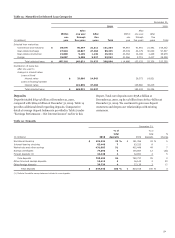
Noninterest Expense
Table 8: Noninterest Expense
Year ended December 31,
(in millions) 2010
2009
2008
Salaries $ 13,869
13,757
8,260
Commission and incentive
compensation 8,692
8,021
2,676
Employee benefits 4,651
4,689
2,004
Equipment 2,636
2,506
1,357
Net occupancy 3,030
3,127
1,619
Core deposit and other intangibles 2,199
2,577
186
FDIC and other deposit
assessments 1,197
1,849
120
Outside professional services 2,370
1,982
847
Contract services 1,642
1,088
407
Foreclosed assets 1,537
1,071
414
Operating losses 1,258
875
142
Outside data processing 1,046
1,027
480
Postage, stationery and supplies 944
933
556
Travel and entertainment 783
575
447
Advertising and promotion 630
572
378
Telecommunications 596
610
321
Insurance 464
845
725
Operating leases 109
227
389
All other 2,803
2,689
1,270
Total $ 50,456
49,020
22,598
Noninterest expense increased $1.4 billion (3%) in 2010 over
2009, primarily due to merger integration costs, Wells Fargo
Financial restructuring costs and a charitable donation to the
Wells Fargo Foundation. The increase in 2009 over 2008 was
predominantly due to the acquisition of Wachovia, increased
staffing and other costs related to problem loan modifications
and workouts, special deposit assessments and operating losses.
Merger integration costs totaled $1.9 billion in 2010 and
$1.1 billion in 2009, and primarily contributed to the increases
in outside professional and contract services for both years. The
acquisition of Wachovia resulted in an expanded geographic
platform in our banking businesses and added capabilities in
businesses such as retail brokerage, asset management and
investment banking. As part of our integration investment to
enhance both the short- and long-term benefits to our
customers, we added platform team members in the Eastern
market to align Wachovia’s banking stores with Wells Fargo’s
sales and service model. We completed the second year of our
merger integration, converting 749 Wachovia stores in Alabama,
Arizona, California, Georgia, Illinois, Kansas, Mississippi,
Nevada, Tennessee and Texas. We migrated major processing
systems for credit card, mortgage, trust, and mutual funds. We
expect to substantially complete our integration of Wachovia by
the end of 2011.
In July 2010, we announced the restructuring of our Wells
Fargo Financial consumer finance division, including the closing
of 638 Wells Fargo Financial stores, realigning this business into
other Wells Fargo business units and transitioning employees
into other parts of our organization. The restructuring costs
totaled $161 million, predominantly for severance and store
closures.
46