Wells Fargo 2010 Annual Report Download - page 128
Download and view the complete annual report
Please find page 128 of the 2010 Wells Fargo annual report below. You can navigate through the pages in the report by either clicking on the pages listed below, or by using the keyword search tool below to find specific information within the annual report.-
 1
1 -
2
-
3
-
4
-
5
-
6
-
7
-
8
-
9
-
10
-
11
-
12
-
13
-
14
-
15
-
16
-
17
-
18
-
19
-
20
-
21
-
22
-
23
-
24
-
25
-
26
-
27
-
28
-
29
-
30
-
31
-
32
-
33
-
34
-
35
-
36
-
37
-
38
-
39
-
40
-
41
-
42
-
43
-
44
-
45
-
46
-
47
-
48
-
49
-
50
-
51
-
52
-
53
-
54
-
55
-
56
-
57
-
58
-
59
-
60
-
61
-
62
-
63
-
64
-
65
-
66
-
67
-
68
-
69
-
70
-
71
-
72
-
73
-
74
-
75
-
76
-
77
-
78
-
79
-
80
-
81
-
82
-
83
-
84
-
85
-
86
-
87
-
88
-
89
-
90
-
91
-
92
-
93
-
94
-
95
-
96
-
97
-
98
-
99
-
100
-
101
-
102
-
103
-
104
-
105
-
106
-
107
-
108
-
109
-
110
-
111
-
112
-
113
-
114
-
115
-
116
-
117
-
 118
118 -
 119
119 -
 120
120 -
 121
121 -
 122
122 -
 123
123 -
 124
124 -
 125
125 -
 126
126 -
 127
127 -
 128
128 -
 129
129 -
 130
130 -
 131
131 -
 132
132 -
 133
133 -
 134
134 -
 135
135 -
 136
136 -
 137
137 -
 138
138 -
139
-
140
-
141
-
142
-
143
-
144
-
145
-
146
-
147
-
148
-
149
-
150
-
151
-
152
-
153
-
154
-
155
-
156
-
157
-
158
-
159
-
160
-
161
-
162
-
163
-
164
-
165
-
166
-
167
-
168
-
169
-
170
-
171
-
172
-
173
-
174
-
175
-
176
-
177
-
178
-
179
-
180
-
181
-
182
-
183
-
184
-
185
-
186
-
187
-
188
-
189
-
190
-
191
-
192
-
193
-
194
-
195
-
196
-
197
-
198
-
199
-
200
-
201
-
202
-
203
-
204
-
205
-
206
-
207
-
208
-
209
-
210
-
211
-
212
-
213
-
214
-
215
-
216
-
217
-
218
-
219
-
220
-
221
-
222
-
223
-
224
-
225
-
226
-
227
-
228
-
229
-
230
-
231
-
232
 |
 |

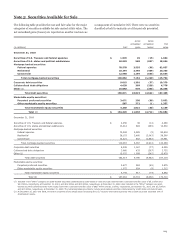
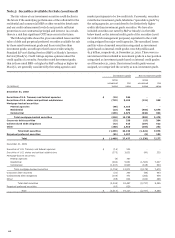
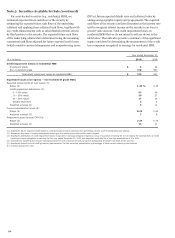
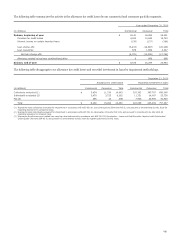
Note 5: Securities Available for Sale (continued)
The fair values of our investment securities could decline in
the future if the underlying performance of the collateral for the
residential and commercial MBS or other securities deteriorate
and our credit enhancement levels do not provide sufficient
protection to our contractual principal and interest. As a result,
there is a risk that significant OTTI may occur in the future.
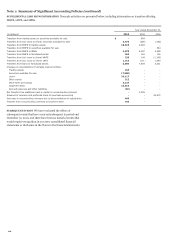
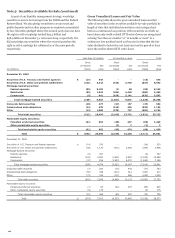
The following table shows the gross unrealized losses and fair
value of debt and perpetual preferred securities available for sale
by those rated investment grade and those rated less than
investment grade, according to their lowest credit rating by
Standard & Poor’s Rating Services (S&P) or Moody’s Investors
Service (Moody’s). Credit ratings express opinions about the
credit quality of a security. Securities rated investment grade,
that is those rated BBB- or higher by S&P or Baa3 or higher by
Moody’s, are generally considered by the rating agencies and
market participants to be low credit risk. Conversely, securities
rated below investment grade, labeled as “speculative grade” by
the rating agencies, are considered to be distinctively higher
credit risk than investment grade securities. We have also
included securities not rated by S&P or Moody’s in the table
below based on the internal credit grade of the securities (used
for credit risk management purposes) equivalent to the credit
rating assigned by major credit agencies. The unrealized losses
and fair value of unrated securities categorized as investment
grade based on internal credit grades were $83 million and
$1.3 billion, respectively, at December 31, 2010. There were no
unrated securities included in investment grade in a loss position
categorized as investment grade based on internal credit grades
as of December 31, 2009. If an internal credit grade was not
assigned, we categorized the security as non-investment grade.
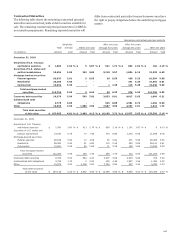
Investment grade
Non-investment grade
Gross
Gross
unrealized
Fair
unrealized
Fair
(in millions) losses
value
losses
value
December 31, 2010
Securities of U.S. Treasury and federal agencies $ (15)
544
-
-
Securities of U.S. states and political subdivisions (722)
8,423
(115)
539
Mortgage-backed securities:
Federal agencies (96)
8,163
-
-
Residential (23)
888
(466)
4,575
Commercial (299)
4,679
(336)
903
Total mortgage-backed securities (418)
13,730
(802)
5,478
Corporate debt securities (22)
330
(15)
304
Collateralized debt obligations (42)
613
(187)
522
Other (180)
2,510
(103)
232
Total debt securities (1,399)
26,150
(1,222)
7,075
Perpetual preferred securities (81)
1,327
(8)
102
Total $ (1,480)
27,477
(1,230)
7,177
December 31, 2009
Securities of U.S. Treasury and federal agencies $ (14)
530
-
-
Securities of U.S. states and political subdivisions (275)
3,621
(90)
325
Mortgage-backed securities:
Federal agencies (9)
767
-
-
Residential (480)
5,661
(1,563)
7,027
Commercial (1,247)
6,543
(615)
643
Total mortgage-backed securities (1,736)
12,971
(2,178)
7,670
Corporate debt securities (31)
260
(46)
463
Collateralized debt obligations (104)
471
(263)
439
Other (85)
644
(160)
388
Total debt securities (2,245)
18,497
(2,737)
9,285
Perpetual preferred securities (65)
620
-
-
Total $ (2,310)
19,117
(2,737)
9,285
126