Wells Fargo 2010 Annual Report Download - page 60
Download and view the complete annual report
Please find page 60 of the 2010 Wells Fargo annual report below. You can navigate through the pages in the report by either clicking on the pages listed below, or by using the keyword search tool below to find specific information within the annual report.-
 1
1 -
2
-
3
-
4
-
5
-
6
-
7
-
8
-
9
-
10
-
11
-
12
-
13
-
14
-
15
-
16
-
17
-
18
-
19
-
20
-
21
-
22
-
23
-
24
-
25
-
26
-
27
-
28
-
29
-
30
-
31
-
32
-
33
-
34
-
35
-
36
-
37
-
38
-
39
-
40
-
41
-
42
-
43
-
44
-
45
-
46
-
47
-
48
-
49
-
 50
50 -
 51
51 -
 52
52 -
 53
53 -
 54
54 -
 55
55 -
 56
56 -
 57
57 -
 58
58 -
 59
59 -
 60
60 -
 61
61 -
 62
62 -
 63
63 -
 64
64 -
 65
65 -
 66
66 -
 67
67 -
 68
68 -
 69
69 -
 70
70 -
71
-
72
-
73
-
74
-
75
-
76
-
77
-
78
-
79
-
80
-
81
-
82
-
83
-
84
-
85
-
86
-
87
-
88
-
89
-
90
-
91
-
92
-
93
-
94
-
95
-
96
-
97
-
98
-
99
-
100
-
101
-
102
-
103
-
104
-
105
-
106
-
107
-
108
-
109
-
110
-
111
-
112
-
113
-
114
-
115
-
116
-
117
-
118
-
119
-
120
-
121
-
122
-
123
-
124
-
125
-
126
-
127
-
128
-
129
-
130
-
131
-
132
-
133
-
134
-
135
-
136
-
137
-
138
-
139
-
140
-
141
-
142
-
143
-
144
-
145
-
146
-
147
-
148
-
149
-
150
-
151
-
152
-
153
-
154
-
155
-
156
-
157
-
158
-
159
-
160
-
161
-
162
-
163
-
164
-
165
-
166
-
167
-
168
-
169
-
170
-
171
-
172
-
173
-
174
-
175
-
176
-
177
-
178
-
179
-
180
-
181
-
182
-
183
-
184
-
185
-
186
-
187
-
188
-
189
-
190
-
191
-
192
-
193
-
194
-
195
-
196
-
197
-
198
-
199
-
200
-
201
-
202
-
203
-
204
-
205
-
206
-
207
-
208
-
209
-
210
-
211
-
212
-
213
-
214
-
215
-
216
-
217
-
218
-
219
-
220
-
221
-
222
-
223
-
224
-
225
-
226
-
227
-
228
-
229
-
230
-
231
-
232
 |
 |

Risk Management – Credit Risk Management (continued)
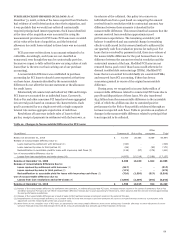
During the recent credit cycle, we have experienced an
increase in requests for extensions of commercial and industrial
and CRE loans, which have repayment guarantees. All
extensions granted are based on a re-underwriting of the loan
and our assessment of the borrower’s ability to perform under
the agreed-upon terms. At the time of extension, borrowers are
generally performing in accordance with the contractual loan
terms. Extension terms generally range from six to thirty-six
months and may require that the borrower provide additional
economic support in the form of partial repayment, amortization
or additional collateral or guarantees. In cases where the value of
collateral or financial condition of the borrower is insufficient to
repay our loan, we may rely upon the support of an outside
repayment guarantee in providing the extension. In considering
the impairment status of the loan, we evaluate the collateral and
future cash flows as well as the anticipated support of any
repayment guarantor. When performance under a loan is not
reasonably assured, including the performance of the guarantor,
we place the loan on nonaccrual status and we charge-off all or a
portion of a loan based on the fair value of the collateral securing
the loan.
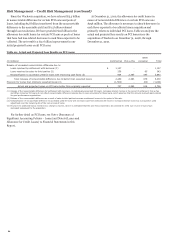
Our ability to seek performance under the guarantee is
directly related to the guarantor’s creditworthiness, capacity and
willingness to perform, which is evaluated on an annual basis, or
more frequently as warranted. Our evaluation is based on the
most current financial information available and is focused on
various key financial metrics, including net worth, leverage, and
current and future liquidity. We consider the guarantor’s
reputation, creditworthiness, and willingness to work with us
based on our analysis as well as other lenders’ experience with
the guarantor. Our assessment of the guarantor’s credit strength
is reflected in our loan risk ratings for such loans. The loan risk
rating is an important factor in our allowance methodology for
commercial and industrial and CRE loans.
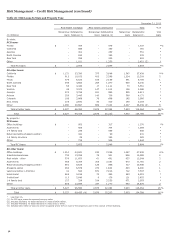
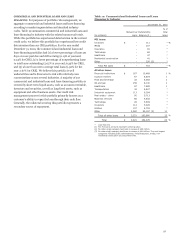
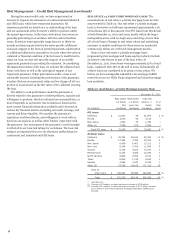
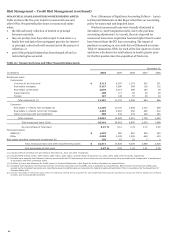
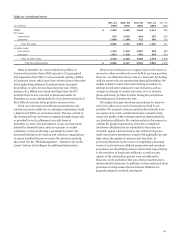
REAL ESTATE 1-4 FAMILY FIRST MORTGAGE LOANS The
concentrations of real estate 1-4 family mortgage loans by state
are presented in Table 20. Our real estate 1-4 family mortgage
loans to borrowers in California represented approximately 14%
of total loans (3% of this amount were PCI loans from Wachovia)
at both December 31, 2010 and 2009, mostly within the larger
metropolitan areas, with no single area consisting of more than
3% of total loans. Changes in real estate values and underlying
economic or market conditions for these areas are monitored
continuously within our credit risk management process.
Some of our real estate 1-4 family mortgage loans
(representing first mortgage and home equity products) include
an interest-only feature as part of the loan terms. At
December 31, 2010, these loans were approximately 25% of total
loans, compared with 26% at the end of 2009. Substantially all
of these loans are considered to be prime or near prime. We
believe we have manageable adjustable-rate mortgage (ARM)
reset risk across our Wells Fargo originated and owned mortgage
loan portfolios.
Table 20: Real Estate 1-4 Family Mortgage Loans by State
December 31, 2010
Real estate
Real estate
Total real
1-4 family
1-4 family
estate 1-4
% of
first
junior lien
family
total
(in millions)
mortgage
mortgage
mortgage
loans
PCI loans:
California $
21,630
49
21,679
3
%
Florida
3,076
56
3,132
*
New Jersey
1,293
36
1,329
*
Other (1)
7,246
109
7,355
*
Total PCI loans $
33,245
250
33,495
4
%
All other loans:
California $
55,794
26,612
82,406
11
%
Florida
17,296
7,782
25,078
3
New Jersey
8,908
6,403
15,311
2
New York
8,169
3,709
11,878
2
Virginia
6,145
4,622
10,767
1
Pennsylvania
6,233
4,066
10,299
1
North Carolina
5,860
3,552
9,412
1
Texas
6,645
1,519
8,164
1
Georgia
4,886
3,472
8,358
1
Other (2)
77,054
34,162
111,216
15
Total all
other loans $
196,990
95,899
292,889
39
%
Total $
230,235
96,149
326,384
43
%
* Less than 1%.
(1) Consists of 45 states; no state had loans in excess of $759 million.
(2) Consists of 41 states; no state had loans in excess of $7.2 billion. Includes
$15.5 billion in Government National Mortgage Association (GNMA) pool
buyouts.
58