Wells Fargo 2010 Annual Report Download - page 164
Download and view the complete annual report
Please find page 164 of the 2010 Wells Fargo annual report below. You can navigate through the pages in the report by either clicking on the pages listed below, or by using the keyword search tool below to find specific information within the annual report.-
 1
1 -
2
-
3
-
4
-
5
-
6
-
7
-
8
-
9
-
10
-
11
-
12
-
13
-
14
-
15
-
16
-
17
-
18
-
19
-
20
-
21
-
22
-
23
-
24
-
25
-
26
-
27
-
28
-
29
-
30
-
31
-
32
-
33
-
34
-
35
-
36
-
37
-
38
-
39
-
40
-
41
-
42
-
43
-
44
-
45
-
46
-
47
-
48
-
49
-
50
-
51
-
52
-
53
-
54
-
55
-
56
-
57
-
58
-
59
-
60
-
61
-
62
-
63
-
64
-
65
-
66
-
67
-
68
-
69
-
70
-
71
-
72
-
73
-
74
-
75
-
76
-
77
-
78
-
79
-
80
-
81
-
82
-
83
-
84
-
85
-
86
-
87
-
88
-
89
-
90
-
91
-
92
-
93
-
94
-
95
-
96
-
97
-
98
-
99
-
100
-
101
-
102
-
103
-
104
-
105
-
106
-
107
-
108
-
109
-
110
-
111
-
112
-
113
-
114
-
115
-
116
-
117
-
118
-
119
-
120
-
121
-
122
-
123
-
124
-
125
-
126
-
127
-
128
-
129
-
130
-
131
-
132
-
133
-
134
-
135
-
136
-
137
-
138
-
139
-
140
-
141
-
142
-
143
-
144
-
145
-
146
-
147
-
148
-
149
-
150
-
151
-
152
-
153
-
 154
154 -
 155
155 -
 156
156 -
 157
157 -
 158
158 -
 159
159 -
 160
160 -
 161
161 -
 162
162 -
 163
163 -
 164
164 -
 165
165 -
 166
166 -
 167
167 -
 168
168 -
 169
169 -
 170
170 -
 171
171 -
 172
172 -
 173
173 -
 174
174 -
175
-
176
-
177
-
178
-
179
-
180
-
181
-
182
-
183
-
184
-
185
-
186
-
187
-
188
-
189
-
190
-
191
-
192
-
193
-
194
-
195
-
196
-
197
-
198
-
199
-
200
-
201
-
202
-
203
-
204
-
205
-
206
-
207
-
208
-
209
-
210
-
211
-
212
-
213
-
214
-
215
-
216
-
217
-
218
-
219
-
220
-
221
-
222
-
223
-
224
-
225
-
226
-
227
-
228
-
229
-
230
-
231
-
232
 |
 |

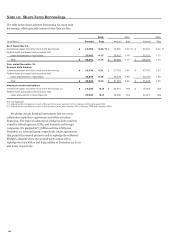
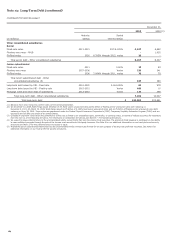
The table below shows selected information for short-term
borrowings, which generally mature in less than 30 days.
Note 12: Short-Term Borrowings
2010
2009
2008
(in millions) Amount
Rate
Amount
Rate
Amount
Rate
As of December 31,
Commercial paper and other short-term borrowings $ 17,454
0.26
%
$ 12,950
0.39
% $ 45,871
0.93
%
Federal funds purchased and securities sold
under agreements to repurchase 37,947
0.15
26,016
0.08
62,203
1.12
Total $ 55,401
0.19
$ 38,966
0.18
$ 108,074
1.04
Year ended December 31,
Average daily balance
Commercial paper and other short-term borrowings $ 16,330
0.31
$ 27,793
0.43
$ 43,792
2.43
Federal funds purchased and securities sold
under agreements to repurchase 30,494
0.18
24,179
0.46
22,034
1.88
Total $ 46,824
0.22
$ 51,972
0.44
$ 65,826
2.25
Maximum month-end balance
Commercial paper and other short-term borrowings (1) $ 17,646
N/A
$ 62,871
N/A
$ 76,009
N/A
Federal funds purchased and securities sold
under agreements to repurchase (2) 37,947
N/A
30,608
N/A
62,203
N/A
N/A- Not Applicable
(1) Highest month-end balance in each of the last three years was March 2010, February 2009 and August 2008.
(2) Highest month-end balance in each of the last three years was December 2010, February 2009 and December 2008.
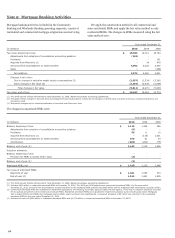
We pledge certain financial instruments that we own to
collateralize repurchase agreements and other securities
financings. The types of collateral we pledge include securities
issued by federal agencies, GSEs, and domestic and foreign
companies. We pledged $27.3 billion and $14.8 billion at
December 31, 2010 and 2009, respectively, under agreements
that permit the secured parties to sell or repledge the collateral.
Pledged collateral where the secured party cannot sell or
repledge was $5.9 billion and $434 million at December 31, 2010
and 2009, respectively.
162