Wells Fargo 2010 Annual Report Download - page 51
Download and view the complete annual report
Please find page 51 of the 2010 Wells Fargo annual report below. You can navigate through the pages in the report by either clicking on the pages listed below, or by using the keyword search tool below to find specific information within the annual report.
Wealth, Brokerage and Retirement provides a full range of
financial advisory services to clients using a planning approach
to meet each client’s needs. Wealth Management provides
affluent and high net worth clients with a complete range of
wealth management solutions including financial planning,
private banking, credit, investment management and trust.
Family Wealth meets the unique needs of the ultra high net
worth customers. Brokerage serves customers’ advisory,
brokerage and financial needs as part of one of the largest full-
service brokerage firms in the United States. Retirement is a
national leader in providing institutional retirement and trust
services (including 401(k) and pension plan record keeping) for
businesses, retail retirement solutions for individuals, and
reinsurance services for the life insurance industry.
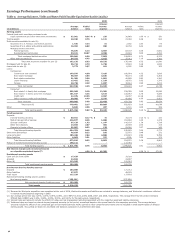
Wealth, Brokerage and Retirement earned net income of
$1.0 billion in 2010. Revenue of $11.7 billion included a mix of
brokerage commissions, asset-based fees and net interest
income. Net interest income growth was dampened by the
continued low short-term interest rate environment. Equity
market gains helped drive growth in fee income. During 2010
client assets grew 6% from a year ago, including managed
account asset growth of 20%. Deposit balances grew 10% during
2010. Expenses increased slightly from the prior year due to
growth in broker commissions partially offset by the realization
of merger synergies during the year and the loss reserve for the
auction rate securities (ARS) legal settlement in 2009. The
wealth, brokerage and retirement businesses have strengthened
partnerships across the Company, working with Community
Banking and Wholesale Banking to provide financial solutions
for clients.
During 2010, our total assets grew 1%, funded by core deposit
growth of 2% and internal capital generation, partially offset by a
reduction in our long-term borrowings. As a result of continued
soft loan demand, our loans decreased 3% and most of our asset
growth was therefore in more liquid earning assets. However,
the strength of our business model continued to produce high
rates of internal capital generation as reflected in our improved
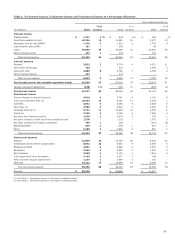
capital ratios. Tier 1 capital increased to 11.16% as a percentage
of total risk-weighted assets, total capital to 15.01%, Tier 1
leverage to 9.19% and Tier 1 common equity to 8.30% at
December 31, 2010, up from 9.25%, 13.26%, 7.87% and 6.46%,
respectively, at December 31, 2009. At December 31, 2010, core
deposits funded 105% of the loan portfolio, and we have
significant capacity to add loans and higher yielding long-term
MBS to generate future revenue and earnings growth.
Balance Sheet Analysis
The following discussion provides additional information
about the major components of our balance sheet. Information
about changes in our asset mix and about our capital is included
in the “Earnings Performance – Net Interest Income” and
“Capital Management” sections of this Report.
Securities Available for Sale
Table 10: Securities Available for Sale – Summary
December 31,
2010
2009
Net
Net
unrealized
Fair
unrealized
Fair
(in millions) Cost
gain
value
Cost
gain
value
Debt securities available for sale $ 160,071
7,394
167,465
162,314
4,804
167,118
Marketable equity securities 4,258
931
5,189
4,749
843
5,592
Total securities available for sale $ 164,329
8,325
172,654
167,063
5,647
172,710
Table 10 presents a summary of our securities available-for-
sale portfolio. Securities available for sale consist of both debt
and marketable equity securities. We hold debt securities
available for sale primarily for liquidity, interest rate risk
management and long-term yield enhancement. Accordingly,
this portfolio consists primarily of very liquid, high-quality
federal agency debt and privately issued MBS. The total net
unrealized gains on securities available for sale were $8.3 billion
at December 31, 2010, up from net unrealized gains of
$5.6 billion at December 31, 2009, due to a general decline in
long-term yields and narrowing of credit spreads.
We analyze securities for OTTI quarterly, or more often if a
potential loss-triggering event occurs. Of the $692 million OTTI
write-downs in 2010, $672 million related to debt securities and
$20 million to equity securities. For a discussion of our OTTI
accounting policies and underlying considerations and analysis
see Note 1 (Summary of Significant Accounting Policies –
Securities) and Note 5 (Securities Available for Sale) to Financial
Statements in this Report.
At December 31, 2010, debt securities available for sale
included $19 billion of municipal bonds, of which 84% were
rated “A-” or better, based on external, and in some cases
internal, ratings. Additionally, some of these bonds are
guaranteed against loss by bond insurers. These bonds are
predominantly investment grade and were generally
underwritten in accordance with our own investment standards
prior to the determination to purchase, without relying on the
bond insurer’s guarantee in making the investment decision.
These municipal bonds will continue to be monitored as part of
49


