Wells Fargo 2010 Annual Report Download - page 182
Download and view the complete annual report
Please find page 182 of the 2010 Wells Fargo annual report below. You can navigate through the pages in the report by either clicking on the pages listed below, or by using the keyword search tool below to find specific information within the annual report.-
 1
1 -
2
-
3
-
4
-
5
-
6
-
7
-
8
-
9
-
10
-
11
-
12
-
13
-
14
-
15
-
16
-
17
-
18
-
19
-
20
-
21
-
22
-
23
-
24
-
25
-
26
-
27
-
28
-
29
-
30
-
31
-
32
-
33
-
34
-
35
-
36
-
37
-
38
-
39
-
40
-
41
-
42
-
43
-
44
-
45
-
46
-
47
-
48
-
49
-
50
-
51
-
52
-
53
-
54
-
55
-
56
-
57
-
58
-
59
-
60
-
61
-
62
-
63
-
64
-
65
-
66
-
67
-
68
-
69
-
70
-
71
-
72
-
73
-
74
-
75
-
76
-
77
-
78
-
79
-
80
-
81
-
82
-
83
-
84
-
85
-
86
-
87
-
88
-
89
-
90
-
91
-
92
-
93
-
94
-
95
-
96
-
97
-
98
-
99
-
100
-
101
-
102
-
103
-
104
-
105
-
106
-
107
-
108
-
109
-
110
-
111
-
112
-
113
-
114
-
115
-
116
-
117
-
118
-
119
-
120
-
121
-
122
-
123
-
124
-
125
-
126
-
127
-
128
-
129
-
130
-
131
-
132
-
133
-
134
-
135
-
136
-
137
-
138
-
139
-
140
-
141
-
142
-
143
-
144
-
145
-
146
-
147
-
148
-
149
-
150
-
151
-
152
-
153
-
154
-
155
-
156
-
157
-
158
-
159
-
160
-
161
-
162
-
163
-
164
-
165
-
166
-
167
-
168
-
169
-
170
-
171
-
 172
172 -
 173
173 -
 174
174 -
 175
175 -
 176
176 -
 177
177 -
 178
178 -
 179
179 -
 180
180 -
 181
181 -
 182
182 -
 183
183 -
 184
184 -
 185
185 -
 186
186 -
 187
187 -
 188
188 -
 189
189 -
 190
190 -
 191
191 -
 192
192 -
193
-
194
-
195
-
196
-
197
-
198
-
199
-
200
-
201
-
202
-
203
-
204
-
205
-
206
-
207
-
208
-
209
-
210
-
211
-
212
-
213
-
214
-
215
-
216
-
217
-
218
-
219
-
220
-
221
-
222
-
223
-
224
-
225
-
226
-
227
-
228
-
229
-
230
-
231
-
232
 |
 |
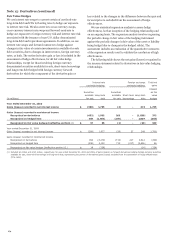
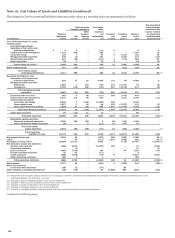
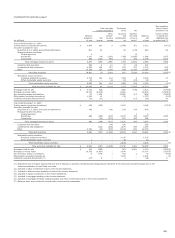
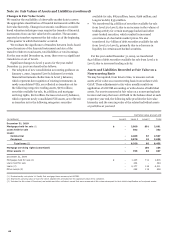
Note 16: Fair Values of Assets and Liabilities (continued)
We incorporate lack of liquidity into our fair value
measurement based on the type of asset or liability measured
and the valuation methodology used. For example, for certain
residential MHFS and certain securities where the significant
inputs have become unobservable due to illiquid markets and
vendor or broker pricing is not used, we use a discounted cash
flow technique to measure fair value. This technique
incorporates forecasting of expected cash flows (adjusted for
credit loss assumptions and estimated prepayment speeds)
discounted at an appropriate market discount rate to reflect the
lack of liquidity in the market that a market participant would
consider. For other securities where vendor or broker pricing is
used, we use either unadjusted broker quotes or vendor prices or
vendor or broker prices adjusted by weighting them with
internal discounted cash flow techniques to measure fair value.
These unadjusted vendor or broker prices inherently reflect any
lack of liquidity in the market as the fair value measurement
represents an exit price from a market participant viewpoint.
Following are descriptions of the valuation methodologies
used for assets and liabilities recorded at fair value on a
recurring or nonrecurring basis and for estimating fair value for
financial instruments not recorded at fair value.
Assets
SHORT-TERM FINANCIAL ASSETS
Short-term financial assets
include cash and due from banks, federal funds sold and
securities purchased under resale agreements and due from
customers on acceptances. These assets are carried at historical
cost. The carrying amount is a reasonable estimate of fair value
because of the relatively short time between the origination of
the instrument and its expected realization.
TRADING ASSETS (EXCLUDING DERIVATIVES) AND
SECURITIES AVAILABLE FOR SALE Trading assets and
securities available for sale are recorded at fair value on a
recurring basis. Fair value measurement is based upon quoted
prices in active markets, if available. Such instruments are
classified within Level 1 of the fair value hierarchy. Examples
include exchange-traded equity securities and some highly liquid
government securities such as U.S. Treasuries. When
instruments are traded in secondary markets and quoted market
prices do not exist for such securities, we generally rely on
internal valuation techniques or on prices obtained from
independent pricing services or brokers (collectively, vendors) or
combination thereof.
Trading securities are mostly valued using trader prices that
are subject to independent price verification procedures. The
majority of fair values derived using internal valuation
techniques are verified against multiple pricing sources,
including prices obtained from independent vendors. Vendors
compile prices from various sources and often apply matrix
pricing for similar securities when no price is observable. We
review pricing methodologies provided by the vendors in order
to determine if observable market information is being used,
versus unobservable inputs. When evaluating the
appropriateness of an internal trader price compared with
vendor prices, considerations include the range and quality of
vendor prices. Vendor prices are used to ensure the
reasonableness of a trader price; however valuing financial
instruments involves judgments acquired from knowledge of a
particular market and is not perfunctory. If a trader asserts that
a vendor price is not reflective of market value, justification for
using the trader price, including recent sales activity where
possible, must be provided to and approved by the appropriate
levels of management.
Similarly, while securities available for sale traded in
secondary markets are typically valued using unadjusted vendor
prices or vendor prices adjusted by weighting them with internal
discounted cash flow techniques, these prices are reviewed and,
if deemed inappropriate by a trader who has the most knowledge
of a particular market, can be adjusted. Securities measured with
these internal valuation techniques are generally classified as
Level 2 of the hierarchy and often involve using quoted market
prices for similar securities, pricing models, discounted cash
flow analyses using significant inputs observable in the market
where available or combination of multiple valuation techniques.
Examples include certain residential and commercial MBS,
municipal bonds, U.S. government and agency MBS, and
corporate debt securities.
Security fair value measurements using significant inputs
that are unobservable in the market due to limited activity or a
less liquid market are classified as Level 3 in the fair value
hierarchy. Such measurements include securities valued using
internal models or combination of multiple valuation techniques
such as weighting of internal models and vendor or broker
pricing, where the unobservable inputs are significant to the
overall fair value measurement. Securities classified as Level 3
include certain residential and commercial MBS, asset-backed
securities collateralized by auto leases or loans and cash
reserves, CDOs and CLOs, and certain residual and retained
interests in residential mortgage loan securitizations. CDOs are
valued using the prices of similar instruments, the pricing of
completed or pending third party transactions or the pricing of
the underlying collateral within the CDO. Where vendor or
broker prices are not readily available, management's best
estimate is used.
MORTGAGES HELD FOR SALE (MHFS) We carry substantially all
of our residential MHFS portfolio at fair value. Fair value is
based on independent quoted market prices, where available, or
the prices for other mortgage whole loans with similar
characteristics. As necessary, these prices are adjusted for typical
securitization activities, including servicing value, portfolio
composition, market conditions and liquidity. Most of our MHFS
are classified as Level 2. For the portion where market pricing
data is not available, we use a discounted cash flow model to
estimate fair value and, accordingly, classify as Level 3.
LOANS HELD FOR SALE (LHFS) LHFS are carried at the lower of
cost or market value, or at fair value for certain portfolios that
we intend to hold for trading purposes. The fair value of LHFS is
based on what secondary markets are currently offering for
portfolios with similar characteristics. As such, we classify those
loans subjected to nonrecurring fair value adjustments as
Level 2.
180