Wells Fargo 2010 Annual Report Download - page 130
Download and view the complete annual report
Please find page 130 of the 2010 Wells Fargo annual report below. You can navigate through the pages in the report by either clicking on the pages listed below, or by using the keyword search tool below to find specific information within the annual report.-
 1
1 -
2
-
3
-
4
-
5
-
6
-
7
-
8
-
9
-
10
-
11
-
12
-
13
-
14
-
15
-
16
-
17
-
18
-
19
-
20
-
21
-
22
-
23
-
24
-
25
-
26
-
27
-
28
-
29
-
30
-
31
-
32
-
33
-
34
-
35
-
36
-
37
-
38
-
39
-
40
-
41
-
42
-
43
-
44
-
45
-
46
-
47
-
48
-
49
-
50
-
51
-
52
-
53
-
54
-
55
-
56
-
57
-
58
-
59
-
60
-
61
-
62
-
63
-
64
-
65
-
66
-
67
-
68
-
69
-
70
-
71
-
72
-
73
-
74
-
75
-
76
-
77
-
78
-
79
-
80
-
81
-
82
-
83
-
84
-
85
-
86
-
87
-
88
-
89
-
90
-
91
-
92
-
93
-
94
-
95
-
96
-
97
-
98
-
99
-
100
-
101
-
102
-
103
-
104
-
105
-
106
-
107
-
108
-
109
-
110
-
111
-
112
-
113
-
114
-
115
-
116
-
117
-
118
-
119
-
 120
120 -
 121
121 -
 122
122 -
 123
123 -
 124
124 -
 125
125 -
 126
126 -
 127
127 -
 128
128 -
 129
129 -
 130
130 -
 131
131 -
 132
132 -
 133
133 -
 134
134 -
 135
135 -
 136
136 -
 137
137 -
 138
138 -
 139
139 -
 140
140 -
141
-
142
-
143
-
144
-
145
-
146
-
147
-
148
-
149
-
150
-
151
-
152
-
153
-
154
-
155
-
156
-
157
-
158
-
159
-
160
-
161
-
162
-
163
-
164
-
165
-
166
-
167
-
168
-
169
-
170
-
171
-
172
-
173
-
174
-
175
-
176
-
177
-
178
-
179
-
180
-
181
-
182
-
183
-
184
-
185
-
186
-
187
-
188
-
189
-
190
-
191
-
192
-
193
-
194
-
195
-
196
-
197
-
198
-
199
-
200
-
201
-
202
-
203
-
204
-
205
-
206
-
207
-
208
-
209
-
210
-
211
-
212
-
213
-
214
-
215
-
216
-
217
-
218
-
219
-
220
-
221
-
222
-
223
-
224
-
225
-
226
-
227
-
228
-
229
-
230
-
231
-
232
 |
 |

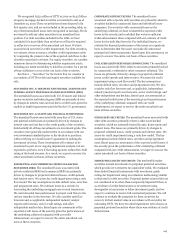
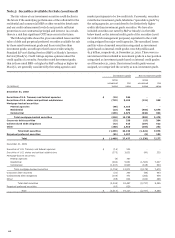
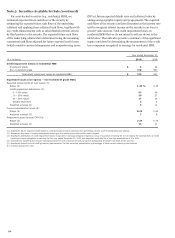
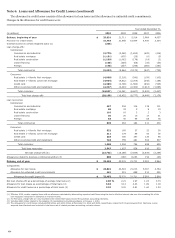
Note 5: Securities Available for Sale (continued)
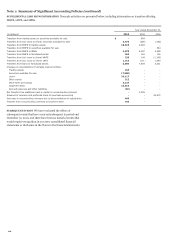
Realized Gains and Losses
The following table shows the gross realized gains and losses on
sales and OTTI write-downs related to the securities available-
for-sale portfolio, which includes marketable equity securities, as
well as net realized gains and losses on nonmarketable equity
securities (see Note 7 – Other Assets).
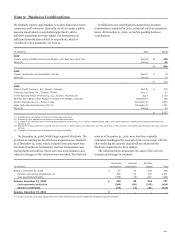
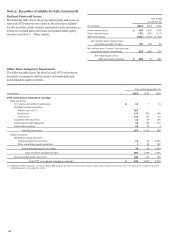
Other-Than-Temporary Impairment
The following table shows the detail of total OTTI write-downs
included in earnings for debt securities and marketable and
nonmarketable equity securities.
Year ended
December 31,
(in millions) 2010
2009
2008
Gross realized gains $ 645
1,601
1,920
Gross realized losses (32)
(160)
(101)
OTTI write-downs (692)
(1,094)
(1,790)
Net realized gains (losses) from
securities available for sale (79)
347
29
Net realized gains (losses) from principal
and private equity investments 534
(289)
251
Net realized gains from
debt and equity securities $ 455
58
280
Year ended December 31,
(in millions) 2010
2009
2008
OTTI write-downs included in earnings
Debt securities:
U.S. states and political subdivisions $ 16
7
14
Mortgage-backed securities:
Federal agencies (1) 267
-
-
Residential 175
595
183
Commercial 120
137
23
Corporate debt securities 10
69
176
Collateralized debt obligations 15
125
147
Other debt securities 69
79
3
Total debt securities 672
1,012
546
Equity securities:
Marketable equity securities:
Perpetual preferred securities 15
50
1,057
Other marketable equity securities 5
32
187
Total marketable equity securities 20
82
1,244
Total securities available for sale 692
1,094
1,790
Nonmarketable equity securities 248
573
220
Total OTTI write-downs included in earnings $ 940
1,667
2,010
(1) Represents OTTI recognized on federal agency MBS because we had the intent to sell, of which $252 million relates to securities with a fair value of $14.5 billion that were
sold subsequent to December 31, 2010.
128