Wells Fargo 2010 Annual Report Download - page 142
Download and view the complete annual report
Please find page 142 of the 2010 Wells Fargo annual report below. You can navigate through the pages in the report by either clicking on the pages listed below, or by using the keyword search tool below to find specific information within the annual report.-
 1
1 -
2
-
3
-
4
-
5
-
6
-
7
-
8
-
9
-
10
-
11
-
12
-
13
-
14
-
15
-
16
-
17
-
18
-
19
-
20
-
21
-
22
-
23
-
24
-
25
-
26
-
27
-
28
-
29
-
30
-
31
-
32
-
33
-
34
-
35
-
36
-
37
-
38
-
39
-
40
-
41
-
42
-
43
-
44
-
45
-
46
-
47
-
48
-
49
-
50
-
51
-
52
-
53
-
54
-
55
-
56
-
57
-
58
-
59
-
60
-
61
-
62
-
63
-
64
-
65
-
66
-
67
-
68
-
69
-
70
-
71
-
72
-
73
-
74
-
75
-
76
-
77
-
78
-
79
-
80
-
81
-
82
-
83
-
84
-
85
-
86
-
87
-
88
-
89
-
90
-
91
-
92
-
93
-
94
-
95
-
96
-
97
-
98
-
99
-
100
-
101
-
102
-
103
-
104
-
105
-
106
-
107
-
108
-
109
-
110
-
111
-
112
-
113
-
114
-
115
-
116
-
117
-
118
-
119
-
120
-
121
-
122
-
123
-
124
-
125
-
126
-
127
-
128
-
129
-
130
-
131
-
 132
132 -
 133
133 -
 134
134 -
 135
135 -
 136
136 -
 137
137 -
 138
138 -
 139
139 -
 140
140 -
 141
141 -
 142
142 -
 143
143 -
 144
144 -
 145
145 -
 146
146 -
 147
147 -
 148
148 -
 149
149 -
 150
150 -
 151
151 -
 152
152 -
153
-
154
-
155
-
156
-
157
-
158
-
159
-
160
-
161
-
162
-
163
-
164
-
165
-
166
-
167
-
168
-
169
-
170
-
171
-
172
-
173
-
174
-
175
-
176
-
177
-
178
-
179
-
180
-
181
-
182
-
183
-
184
-
185
-
186
-
187
-
188
-
189
-
190
-
191
-
192
-
193
-
194
-
195
-
196
-
197
-
198
-
199
-
200
-
201
-
202
-
203
-
204
-
205
-
206
-
207
-
208
-
209
-
210
-
211
-
212
-
213
-
214
-
215
-
216
-
217
-
218
-
219
-
220
-
221
-
222
-
223
-
224
-
225
-
226
-
227
-
228
-
229
-
230
-
231
-
232
 |
 |

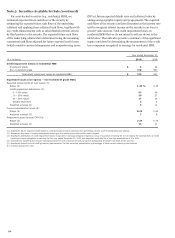
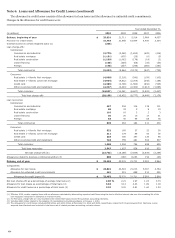
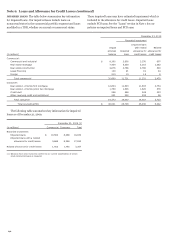
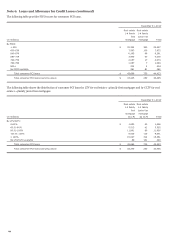
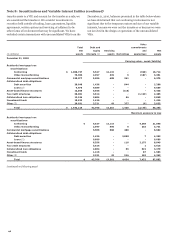
Note 6: Loans and Allowance for Credit Losses (continued)
IMPAIRED LOANS The table below summarizes key information
for impaired loans. Our impaired loans include loans on
nonaccrual status in the commercial portfolio segment and loans
modified in a TDR, whether on accrual or nonaccrual status.
These impaired loans may have estimated impairment which is
included in the allowance for credit losses. Impaired loans
exclude PCI loans. See the “Loans” section in Note 1 for our
policies on impaired loans and PCI loans.
December 31, 2010
Recorded investment
Impaired loans
Unpaid
with related
Related
principal
Impaired
allowance for
allowance for
(in millions) balance
loans
credit losses
credit losses
Commercial:
Commercial and industrial $ 8,190
3,600
3,276
607
Real estate mortgage 7,439
5,239
5,163
1,282
Real estate construction 4,676
2,786
2,786
548
Lease financing 149
91
91
34
Foreign 215
15
15
8
Total commercial 20,669
11,731
11,331
2,479
Consumer:
Real estate 1-4 family first mortgage 12,834
11,603
11,603
2,754
Real estate 1-4 family junior lien mortgage 1,759
1,626
1,626
578
Credit card 548
548
548
333
Other revolving credit and installment 231
230
230
58
Total consumer 15,372
14,007
14,007
3,723
Total (excluding PCI) $ 36,041
25,738
25,338
6,202
The following table summarizes key information for impaired
loans as of December 31, 2009.
December 31, 2009 (1)
(in millions) Commercial
Consumer
Total
Recorded investment:
Impaired loans $ 10,562
8,268
18,830
Impaired loans with a related
allowance for credit losses
9,666
8,268
17,934
Related allowance for credit losses
1,502
1,765
3,267
(1) Balances have been revised to conform to our current classification of certain
small commercial loans as impaired.
140