Wells Fargo 2010 Annual Report Download - page 32
Download and view the complete annual report
Please find page 32 of the 2010 Wells Fargo annual report below. You can navigate through the pages in the report by either clicking on the pages listed below, or by using the keyword search tool below to find specific information within the annual report.-
 1
1 -
2
-
3
-
4
-
5
-
6
-
7
-
8
-
9
-
10
-
11
-
12
-
13
-
14
-
15
-
16
-
17
-
18
-
19
-
20
-
21
-
 22
22 -
 23
23 -
 24
24 -
 25
25 -
 26
26 -
 27
27 -
 28
28 -
 29
29 -
 30
30 -
 31
31 -
 32
32 -
 33
33 -
 34
34 -
 35
35 -
 36
36 -
 37
37 -
 38
38 -
 39
39 -
 40
40 -
 41
41 -
 42
42 -
43
-
44
-
45
-
46
-
47
-
48
-
49
-
50
-
51
-
52
-
53
-
54
-
55
-
56
-
57
-
58
-
59
-
60
-
61
-
62
-
63
-
64
-
65
-
66
-
67
-
68
-
69
-
70
-
71
-
72
-
73
-
74
-
75
-
76
-
77
-
78
-
79
-
80
-
81
-
82
-
83
-
84
-
85
-
86
-
87
-
88
-
89
-
90
-
91
-
92
-
93
-
94
-
95
-
96
-
97
-
98
-
99
-
100
-
101
-
102
-
103
-
104
-
105
-
106
-
107
-
108
-
109
-
110
-
111
-
112
-
113
-
114
-
115
-
116
-
117
-
118
-
119
-
120
-
121
-
122
-
123
-
124
-
125
-
126
-
127
-
128
-
129
-
130
-
131
-
132
-
133
-
134
-
135
-
136
-
137
-
138
-
139
-
140
-
141
-
142
-
143
-
144
-
145
-
146
-
147
-
148
-
149
-
150
-
151
-
152
-
153
-
154
-
155
-
156
-
157
-
158
-
159
-
160
-
161
-
162
-
163
-
164
-
165
-
166
-
167
-
168
-
169
-
170
-
171
-
172
-
173
-
174
-
175
-
176
-
177
-
178
-
179
-
180
-
181
-
182
-
183
-
184
-
185
-
186
-
187
-
188
-
189
-
190
-
191
-
192
-
193
-
194
-
195
-
196
-
197
-
198
-
199
-
200
-
201
-
202
-
203
-
204
-
205
-
206
-
207
-
208
-
209
-
210
-
211
-
212
-
213
-
214
-
215
-
216
-
217
-
218
-
219
-
220
-
221
-
222
-
223
-
224
-
225
-
226
-
227
-
228
-
229
-
230
-
231
-
232
 |
 |

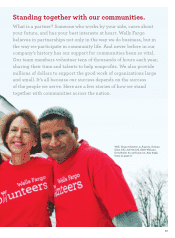
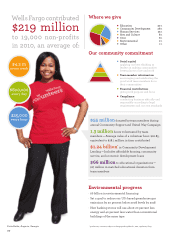
$4.2 m
every week
$600,000
every day
$25,000
every hour
Where we give
• Education 30%
• Community Development 28%
• Human Services 25%
• Arts and Culture 8%
• Civic 6%
• Environmental 2%
• Other 1%
Our community commitment
• Social capital
applying our best thinking as
leaders in making communities
better places to live and work
• Team member volunteerism
encouraging and celebrating the
good work team members do in
their communities
• Financial contributions
giving with purpose and focus
• Compliance
conducting business ethically and
responsibly according to legal
requirements and our own standards
$55million donated by team members during
annual Community Support and United Way Campaign
1.3million hours volunteered by team
members — Average value of a volunteer hour: $20.85,
equivalent to $28.1million in time contributed
$1.24billion* in Community Development
Lending—Includes a ordable housing, community
service, and economic development loans
$66million to educational organizations—
$17million in matched educational donation from
teammembers
Environmental progress
· $6billion in environmental fi nancing
· Set a goal to reduce our U.S.-based greenhouse gas
emissions by 20percent below 2008 levels by 2018
· New banking stores will use about 20percent less
energy and 40percent less water than conventional
buildings of the same type
* preliminary estimate; subject to change pending March 1, 2011, regulatory fi ling
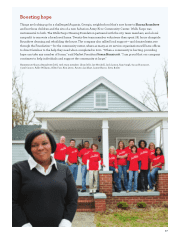
Evita Butler, Augusta, Georgia
Wells Fargo contributed
$219 million
to 19,000 non-profits
in 2010, an average of: