Wells Fargo 2010 Annual Report Download - page 214
Download and view the complete annual report
Please find page 214 of the 2010 Wells Fargo annual report below. You can navigate through the pages in the report by either clicking on the pages listed below, or by using the keyword search tool below to find specific information within the annual report.-
 1
1 -
2
-
3
-
4
-
5
-
6
-
7
-
8
-
9
-
10
-
11
-
12
-
13
-
14
-
15
-
16
-
17
-
18
-
19
-
20
-
21
-
22
-
23
-
24
-
25
-
26
-
27
-
28
-
29
-
30
-
31
-
32
-
33
-
34
-
35
-
36
-
37
-
38
-
39
-
40
-
41
-
42
-
43
-
44
-
45
-
46
-
47
-
48
-
49
-
50
-
51
-
52
-
53
-
54
-
55
-
56
-
57
-
58
-
59
-
60
-
61
-
62
-
63
-
64
-
65
-
66
-
67
-
68
-
69
-
70
-
71
-
72
-
73
-
74
-
75
-
76
-
77
-
78
-
79
-
80
-
81
-
82
-
83
-
84
-
85
-
86
-
87
-
88
-
89
-
90
-
91
-
92
-
93
-
94
-
95
-
96
-
97
-
98
-
99
-
100
-
101
-
102
-
103
-
104
-
105
-
106
-
107
-
108
-
109
-
110
-
111
-
112
-
113
-
114
-
115
-
116
-
117
-
118
-
119
-
120
-
121
-
122
-
123
-
124
-
125
-
126
-
127
-
128
-
129
-
130
-
131
-
132
-
133
-
134
-
135
-
136
-
137
-
138
-
139
-
140
-
141
-
142
-
143
-
144
-
145
-
146
-
147
-
148
-
149
-
150
-
151
-
152
-
153
-
154
-
155
-
156
-
157
-
158
-
159
-
160
-
161
-
162
-
163
-
164
-
165
-
166
-
167
-
168
-
169
-
170
-
171
-
172
-
173
-
174
-
175
-
176
-
177
-
178
-
179
-
180
-
181
-
182
-
183
-
184
-
185
-
186
-
187
-
188
-
189
-
190
-
191
-
192
-
193
-
194
-
195
-
196
-
197
-
198
-
199
-
200
-
201
-
202
-
203
-
 204
204 -
 205
205 -
 206
206 -
 207
207 -
 208
208 -
 209
209 -
 210
210 -
 211
211 -
 212
212 -
 213
213 -
 214
214 -
 215
215 -
 216
216 -
 217
217 -
 218
218 -
 219
219 -
 220
220 -
 221
221 -
 222
222 -
 223
223 -
 224
224 -
225
-
226
-
227
-
228
-
229
-
230
-
231
-
232
 |
 |

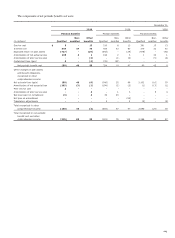
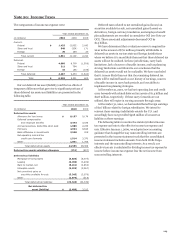
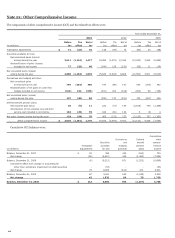
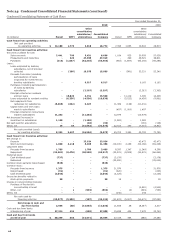
The components of other comprehensive income (OCI) and the related tax effects were:
Note 22: Other Comprehensive Income
Year ended December 31,
2010
2009
2008
Before
Tax
Net of
Before
Tax
Net of
Before
Tax
Net of
(in millions)
tax
effect
tax
tax
effect
tax
tax
effect
tax
Translation adjustments $ 71
(26)
45
118
(45)
73
(93)
35
(58)
Securities available for sale:
Net unrealized gains (losses)
arising during the year 2,611
(1,134)
1,477
15,998
(5,972)
10,026
(10,552)
3,960
(6,592)
Reclassification of gains (losses)
included in net income 77
(29)
48
(349)
129
(220)
(29)
11
(18)
Net unrealized gains (losses)
arising during the year 2,688
(1,163)
1,525
15,649
(5,843)
9,806
(10,581)
3,971
(6,610)
Derivatives and hedging activities:
Net unrealized gains
arising during the year 750
(282)
468
193
(86)
107
955
(363)
592
Reclassification of net gains on cash flow
hedges included in net income (613)
234
(379)
(531)
203
(328)
(252)
96
(156)
Net unrealized gains (losses)
arising during the year 137
(48)
89
(338)
117
(221)
703
(267)
436
Defined benefit pension plans:
Net actuarial gain (loss) 20
(9)
11
222
(73)
149
(2,165)
799
(1,366)
Amortization of net actuarial loss and prior
service cost included in net income 104
(45)
59
184
(60)
124
6
(2)
4
Net gains (losses) arising during the year 124
(54)
70
406
(133)
273
(2,159)
797
(1,362)
Other comprehensive income $ 3,020
(1,291)
1,729
15,835
(5,904)
9,931
(12,130)
4,536
(7,594)
Cumulative OCI balances were:
Cumulative
Derivatives
Defined
other
Securities
and
benefit
compre-
Translation
available
hedging
pension
hensive
(in millions) adjustments
for sale
activities
plans
income
Balance, December 31, 2007 $ 52
398
435
(160)
725
Net change (58)
(6,610)
436
(1,362)
(7,594)
Balance, December 31, 2008 (6)
(6,212)
871
(1,522)
(6,869)
Cumulative effect from change in accounting for
other-than-temporary impairment on debt securities -
(53)
-
-
(53)
Net change 73
9,806
(221)
273
9,931
Balance, December 31, 2009 67
3,541
650
(1,249)
3,009
Net change 45
1,525
89
70
1,729
Balance, December 31, 2010 $ 112
5,066
739
(1,179)
4,738
212