Wells Fargo 2010 Annual Report Download - page 201
Download and view the complete annual report
Please find page 201 of the 2010 Wells Fargo annual report below. You can navigate through the pages in the report by either clicking on the pages listed below, or by using the keyword search tool below to find specific information within the annual report.-
 1
1 -
2
-
3
-
4
-
5
-
6
-
7
-
8
-
9
-
10
-
11
-
12
-
13
-
14
-
15
-
16
-
17
-
18
-
19
-
20
-
21
-
22
-
23
-
24
-
25
-
26
-
27
-
28
-
29
-
30
-
31
-
32
-
33
-
34
-
35
-
36
-
37
-
38
-
39
-
40
-
41
-
42
-
43
-
44
-
45
-
46
-
47
-
48
-
49
-
50
-
51
-
52
-
53
-
54
-
55
-
56
-
57
-
58
-
59
-
60
-
61
-
62
-
63
-
64
-
65
-
66
-
67
-
68
-
69
-
70
-
71
-
72
-
73
-
74
-
75
-
76
-
77
-
78
-
79
-
80
-
81
-
82
-
83
-
84
-
85
-
86
-
87
-
88
-
89
-
90
-
91
-
92
-
93
-
94
-
95
-
96
-
97
-
98
-
99
-
100
-
101
-
102
-
103
-
104
-
105
-
106
-
107
-
108
-
109
-
110
-
111
-
112
-
113
-
114
-
115
-
116
-
117
-
118
-
119
-
120
-
121
-
122
-
123
-
124
-
125
-
126
-
127
-
128
-
129
-
130
-
131
-
132
-
133
-
134
-
135
-
136
-
137
-
138
-
139
-
140
-
141
-
142
-
143
-
144
-
145
-
146
-
147
-
148
-
149
-
150
-
151
-
152
-
153
-
154
-
155
-
156
-
157
-
158
-
159
-
160
-
161
-
162
-
163
-
164
-
165
-
166
-
167
-
168
-
169
-
170
-
171
-
172
-
173
-
174
-
175
-
176
-
177
-
178
-
179
-
180
-
181
-
182
-
183
-
184
-
185
-
186
-
187
-
188
-
189
-
190
-
 191
191 -
 192
192 -
 193
193 -
 194
194 -
 195
195 -
 196
196 -
 197
197 -
 198
198 -
 199
199 -
 200
200 -
 201
201 -
 202
202 -
 203
203 -
 204
204 -
 205
205 -
 206
206 -
 207
207 -
 208
208 -
 209
209 -
 210
210 -
 211
211 -
212
-
213
-
214
-
215
-
216
-
217
-
218
-
219
-
220
-
221
-
222
-
223
-
224
-
225
-
226
-
227
-
228
-
229
-
230
-
231
-
232
 |
 |

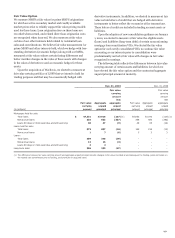
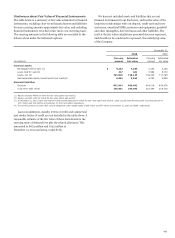
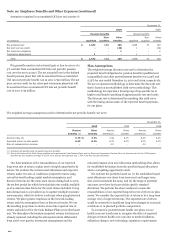
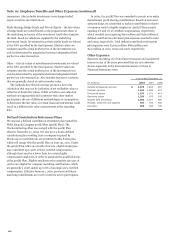
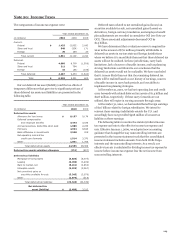
As of December 31, 2010, there was $71 million of
unrecognized compensation cost related to stock options. That
cost is expected to be recognized over a weighted-average period
of 1.1 years. The total intrinsic value of options exercised during
2010, 2009 and 2008 was $298 million, $50 million and
$348 million, respectively.
Cash received from the exercise of stock options for 2010,
2009 and 2008 was $687 million, $153 million and
$747 million, respectively.
We do not have a specific policy on repurchasing shares to
satisfy share option exercises. Rather, we have a general policy
on repurchasing shares to meet common stock issuance
requirements for our benefit plans (including share option
exercises), conversion of our convertible securities, acquisitions
and other corporate purposes. Various factors determine the
amount and timing of our share repurchases, including our
capital requirements, the number of shares we expect to issue for
acquisitions and employee benefit plans, market conditions
(including the trading price of our stock), and regulatory and
legal considerations. These factors can change at any time, and
there can be no assurance as to the number of shares we will
repurchase or when we will repurchase them.
The fair value of each option award granted on or after
January 1, 2006, is estimated using a Black-Scholes valuation
model. The expected term of non-reload options granted is
generally based on the historical exercise behaviour of full-term
options. Our expected volatilities are based on a combination of
the historical volatility of our common stock and implied
volatilities for traded options on our common stock. The risk-
free rate is based on the U.S. Treasury zero-coupon yield curve in
effect at the time of grant. Both expected volatility and the risk-
free rates are based on a period commensurate with our
expected term. For 2010 and 2009, the expected dividend is
based on a fixed dividend amount. For 2008 the expected
dividend was based on the current dividend, consideration of our
historical pattern of dividend increases and the market price of
our stock. We changed our method of estimating the expected
dividend assumption from a yield approach to a fixed amount
due to our participation in the TARP CPP during 2009, which
restricted us from increasing our dividend without approval
from the U.S. Treasury; although we repaid TARP in 2009,
federal approval continues to be required under FRB
Supervisory Letter 09-4, before we can increase our dividend. A
dividend yield approach models a constant dividend yield, which
was considered inappropriate given the restriction on our ability
to increase dividends. See Note 3.
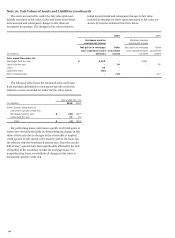
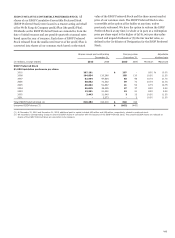
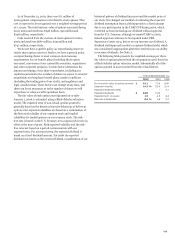
The following table presents the weighted-average per share
fair value of options granted and the assumptions used, based on
a Black-Scholes option valuation model. Substantially all of the
options granted in 2010 resulted from the reload feature.
Year ended December 31,
2010
2009
2008
Per share fair value of options granted $ 6.11
3.29
4.06
Expected volatility 44.3
%
53.9
22.4
Expected dividends (yield) -
-
4.1
Expected dividends $ 0.20
0.33
-
Expected term (in years) 1.3
4.5
4.4
Risk-free interest rate 0.6
%
1.8
2.7
199