Wells Fargo 2010 Annual Report Download - page 45
Download and view the complete annual report
Please find page 45 of the 2010 Wells Fargo annual report below. You can navigate through the pages in the report by either clicking on the pages listed below, or by using the keyword search tool below to find specific information within the annual report.-
 1
1 -
2
-
3
-
4
-
5
-
6
-
7
-
8
-
9
-
10
-
11
-
12
-
13
-
14
-
15
-
16
-
17
-
18
-
19
-
20
-
21
-
22
-
23
-
24
-
25
-
26
-
27
-
28
-
29
-
30
-
31
-
32
-
33
-
34
-
 35
35 -
 36
36 -
 37
37 -
 38
38 -
 39
39 -
 40
40 -
 41
41 -
 42
42 -
 43
43 -
 44
44 -
 45
45 -
 46
46 -
 47
47 -
 48
48 -
 49
49 -
 50
50 -
 51
51 -
 52
52 -
 53
53 -
 54
54 -
 55
55 -
56
-
57
-
58
-
59
-
60
-
61
-
62
-
63
-
64
-
65
-
66
-
67
-
68
-
69
-
70
-
71
-
72
-
73
-
74
-
75
-
76
-
77
-
78
-
79
-
80
-
81
-
82
-
83
-
84
-
85
-
86
-
87
-
88
-
89
-
90
-
91
-
92
-
93
-
94
-
95
-
96
-
97
-
98
-
99
-
100
-
101
-
102
-
103
-
104
-
105
-
106
-
107
-
108
-
109
-
110
-
111
-
112
-
113
-
114
-
115
-
116
-
117
-
118
-
119
-
120
-
121
-
122
-
123
-
124
-
125
-
126
-
127
-
128
-
129
-
130
-
131
-
132
-
133
-
134
-
135
-
136
-
137
-
138
-
139
-
140
-
141
-
142
-
143
-
144
-
145
-
146
-
147
-
148
-
149
-
150
-
151
-
152
-
153
-
154
-
155
-
156
-
157
-
158
-
159
-
160
-
161
-
162
-
163
-
164
-
165
-
166
-
167
-
168
-
169
-
170
-
171
-
172
-
173
-
174
-
175
-
176
-
177
-
178
-
179
-
180
-
181
-
182
-
183
-
184
-
185
-
186
-
187
-
188
-
189
-
190
-
191
-
192
-
193
-
194
-
195
-
196
-
197
-
198
-
199
-
200
-
201
-
202
-
203
-
204
-
205
-
206
-
207
-
208
-
209
-
210
-
211
-
212
-
213
-
214
-
215
-
216
-
217
-
218
-
219
-
220
-
221
-
222
-
223
-
224
-
225
-
226
-
227
-
228
-
229
-
230
-
231
-
232
 |
 |

2008
2007
2006
Interest
Interest
Interest
Average
Yields/
income/
Average
Yields/
income/
Average
Yields/
income/
balance
rates
expense
balance
rates
expense
balance
rates
expense
$ 5,293
1.71
% $ 90
4,468
4.99
% $ 223
5,515
4.80
% $ 265
4,971
3.80
189
4,291
4.37
188
4,958
4.95
245
1,083
3.84
41
848
4.26
36
875
4.36
39
6,918
6.83
501
4,740
7.37
342
3,192
7.98
245
44,777
5.97
2,623
38,592
6.10
2,328
36,691
6.04
2,206
20,749
6.04
1,412
6,548
6.12
399
6,640
6.57
430
65,526
5.99
4,035
45,140
6.10
2,727
43,331
6.12
2,636
12,818
7.17
1,000
6,295
7.52
477
6,204
7.10
439
86,345
6.22
5,577
57,023
6.34
3,582
53,602
6.31
3,359
25,656
6.13
1,573
33,066
6.50
2,150
42,855
6.41
2,746
837
5.69
48
896
7.76
70
630
7.40
47
98,620
6.12
6,034
77,965
8.17
6,367
65,720
8.13
5,340
41,659
5.80
2,416
32,722
7.38
2,414
29,344
7.32
2,148
19,453
5.08
988
16,934
7.80
1,321
14,810
7.94
1,175
7,141
5.62
401
5,921
5.84
346
5,437
5.72
311
7,127
10.50
748
7,321
11.68
855
6,343
12.39
786
174,000
6.08
10,587
140,863
8.02
11,303
121,654
8.02
9,760
75,116
6.67
5,008
61,527
7.25
4,463
57,509
7.27
4,182
75,375
6.55
4,934
72,075
8.12
5,851
64,255
7.98
5,126
19,601
12.13
2,378
15,874
13.58
2,155
12,571
13.29
1,670
54,368
8.72
4,744
54,436
9.71
5,285
50,922
9.60
4,889
224,460
7.60
17,064
203,912
8.71
17,754
185,257
8.57
15,867
398,460
6.94
27,651
344,775
8.43
29,057
306,911
8.35
25,627
1,920
4.73
91
1,402
5.07
71
1,357
4.97
68
$ 523,482
6.69
% $ 35,219
445,921
7.93
% $ 35,341
415,828
7.79
% $ 32,357
$ 5,650
1.12
% $ 64
5,057
3.16
% $ 160
4,302
2.86
% $ 123
166,691
1.32
2,195
147,939
2.78
4,105
134,248
2.40
3,225
39,481
3.08
1,215
40,484
4.38
1,773
32,355
3.91
1,266
6,656
2.83
187
8,937
4.87
435
32,168
4.99
1,607
47,578
1.81
860
36,761
4.57
1,679
20,724
4.60
953
266,056
1.70
4,521
239,178
3.41
8,152
223,797
3.21
7,174
65,826
2.25
1,478
25,854
4.81
1,245
21,471
4.62
992
102,283
3.70
3,789
93,193
5.18
4,824
84,035
4.91
4,124
-
-
-
-
-
-
-
-
-
434,165
2.25
9,788
358,225
3.97
14,221
329,303
3.73
12,290
89,317
-
-
87,696
-
-
86,525
-
-
$ 523,482
1.86
9,788
445,921
3.19
14,221
415,828
2.96
12,290
4.83
% $ 25,431
4.74
% $ 21,120
4.83
% $ 20,067
$ 11,175
11,806
12,466
13,353
11,957
11,114
56,386
51,068
46,615
$ 80,914
74,831
70,195
$ 87,820
88,907
89,117
28,658
26,287
24,221
53,753
47,333
43,382
(89,317)
(87,696)
(86,525)
$ 80,914
74,831
70,195
$ 604,396
520,752
486,023
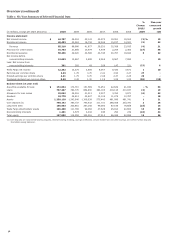
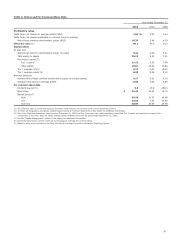
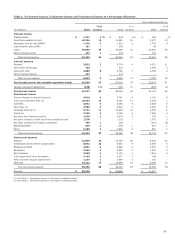
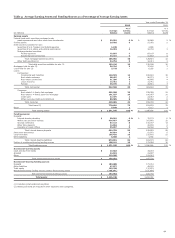
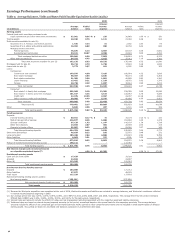
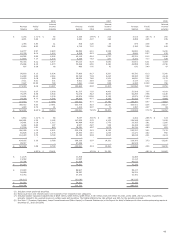
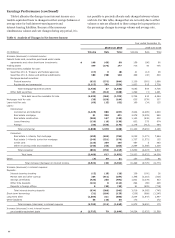
(5) Includes certain preferred securities.
(6) Nonaccrual loans and related income are included in their respective loan categories.
(7) Includes taxable-equivalent adjustments of $629 million, $706 million, $288 million, $146 million and $116 million for 2010, 2009, 2008, 2007 and 2006, respectively,
primarily related to tax-exempt income on certain loans and securities. The federal statutory tax rate utilized was 35% for the periods presented.
(8) See Note 7 (Premises, Equipment, Lease Commitments and Other Assets) to Financial Statements in this Report for detail of balances of other noninterest-earning assets at
December 31, 2010 and 2009.
43