Wells Fargo 2010 Annual Report Download - page 158
Download and view the complete annual report
Please find page 158 of the 2010 Wells Fargo annual report below. You can navigate through the pages in the report by either clicking on the pages listed below, or by using the keyword search tool below to find specific information within the annual report.-
 1
1 -
2
-
3
-
4
-
5
-
6
-
7
-
8
-
9
-
10
-
11
-
12
-
13
-
14
-
15
-
16
-
17
-
18
-
19
-
20
-
21
-
22
-
23
-
24
-
25
-
26
-
27
-
28
-
29
-
30
-
31
-
32
-
33
-
34
-
35
-
36
-
37
-
38
-
39
-
40
-
41
-
42
-
43
-
44
-
45
-
46
-
47
-
48
-
49
-
50
-
51
-
52
-
53
-
54
-
55
-
56
-
57
-
58
-
59
-
60
-
61
-
62
-
63
-
64
-
65
-
66
-
67
-
68
-
69
-
70
-
71
-
72
-
73
-
74
-
75
-
76
-
77
-
78
-
79
-
80
-
81
-
82
-
83
-
84
-
85
-
86
-
87
-
88
-
89
-
90
-
91
-
92
-
93
-
94
-
95
-
96
-
97
-
98
-
99
-
100
-
101
-
102
-
103
-
104
-
105
-
106
-
107
-
108
-
109
-
110
-
111
-
112
-
113
-
114
-
115
-
116
-
117
-
118
-
119
-
120
-
121
-
122
-
123
-
124
-
125
-
126
-
127
-
128
-
129
-
130
-
131
-
132
-
133
-
134
-
135
-
136
-
137
-
138
-
139
-
140
-
141
-
142
-
143
-
144
-
145
-
146
-
147
-
 148
148 -
 149
149 -
 150
150 -
 151
151 -
 152
152 -
 153
153 -
 154
154 -
 155
155 -
 156
156 -
 157
157 -
 158
158 -
 159
159 -
 160
160 -
 161
161 -
 162
162 -
 163
163 -
 164
164 -
 165
165 -
 166
166 -
 167
167 -
 168
168 -
169
-
170
-
171
-
172
-
173
-
174
-
175
-
176
-
177
-
178
-
179
-
180
-
181
-
182
-
183
-
184
-
185
-
186
-
187
-
188
-
189
-
190
-
191
-
192
-
193
-
194
-
195
-
196
-
197
-
198
-
199
-
200
-
201
-
202
-
203
-
204
-
205
-
206
-
207
-
208
-
209
-
210
-
211
-
212
-
213
-
214
-
215
-
216
-
217
-
218
-
219
-
220
-
221
-
222
-
223
-
224
-
225
-
226
-
227
-
228
-
229
-
230
-
231
-
232
 |
 |

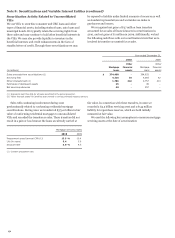
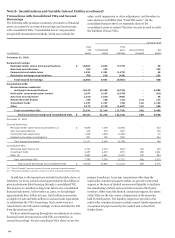
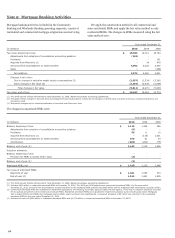
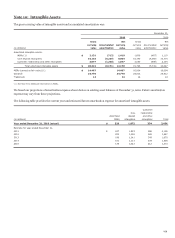
Mortgage banking activities, included in the Community
Banking and Wholesale Banking operating segments, consist of
residential and commercial mortgage originations and servicing.
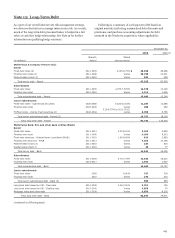
Note 9: Mortgage Banking Activities
We apply the amortization method to all commercial and
some residential MSRs and apply the fair value method to only
residential MSRs. The changes in MSRs measured using the fair
value method were:
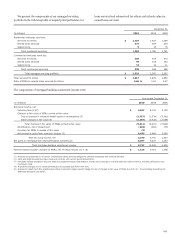
Year ended December 31,
(in millions) 2010
2009
2008
Fair value, beginning of year $ 16,004
14,714
16,763
Adjustments from adoption of consolidation accounting guidance (118)
-
-
Purchases -
-
191
Acquired from Wachovia (1) -
34
479
Servicing from securitizations or asset transfers 4,092
6,226
3,450
Sales -
-
(269)
Net additions 3,974
6,260
3,851
Changes in fair value:
Due to changes in valuation model inputs or assumptions (2) (2,957)
(1,534)
(3,341)
Other changes in fair value (3) (2,554)
(3,436)
(2,559)
Total changes in fair value (5,511)
(4,970)
(5,900)
Fair value, end of year $ 14,467
16,004
14,714
(1) The 2009 amount reflects refinements to initial December 31, 2008, Wachovia purchase accounting adjustments.
(2) Principally reflects changes in discount rates and prepayment speed assumptions, mostly due to changes in interest rates, and costs to service, including delinquency and
foreclosure costs.
(3) Represents changes due to collection/realization of expected cash flows over time.
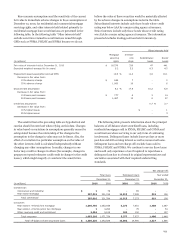
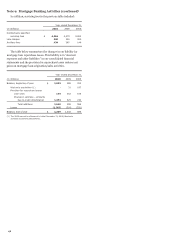
The changes in amortized MSRs were:
Year ended December 31,
(in millions) 2010
2009
2008
Balance, beginning of year $ 1,119
1,446
466
Adjustments from adoption of consolidation accounting guidance (5)
-
-
Purchases 58
11
10
Acquired from Wachovia (1) -
(135)
1,021
Servicing from securitizations or asset transfers 478
61
24
Amortization (228)
(264)
(75)
Balance, end of year (2) 1,422
1,119
1,446
Valuation allowance:
Balance, beginning of year -
-
-
Provision for MSRs in excess of fair value (3)
-
-
Balance, end of year (3) (3)
-
-
Amortized MSRs, net $ 1,419
1,119
1,446
Fair value of amortized MSRs:
Beginning of year $ 1,261
1,555
573
End of year (4) 1,812
1,261
1,555
(1) The 2009 amount reflects refinements to initial December 31, 2008, Wachovia purchase accounting adjustments.
(2) Includes $400 million in residential amortized MSRs at December 31, 2010. The 2009 and 2008 balances are commercial amortized MSRs. For the year ended
December 31, 2010, servicing from securitizations or asset transfers on the residential MSR portfolio was $405 million and the residential MSR amortization was $(5) million.
(3) Commercial amortized MSRs are evaluated for impairment purposes by the following risk strata: agency (GSEs) and non-agency. There was no valuation allowance recorded
for the periods presented on the commercial amortized MSRs. Residential amortized MSRs are evaluated for impairment purposes by the following risk strata: Mortgages
sold to GSEs (FHLMC and FNMA) and mortgages sold to GNMA, each by interest rate stratifications. A valuation allowance of $3 million was recorded on the residential
amortized MSRs for the year ended December 31, 2010.
(4) Includes fair value of $441 million in residential amortized MSRs and $1,371 million in commercial amortized MSRs at December 31, 2010.
156