Wells Fargo 2010 Annual Report Download - page 188
Download and view the complete annual report
Please find page 188 of the 2010 Wells Fargo annual report below. You can navigate through the pages in the report by either clicking on the pages listed below, or by using the keyword search tool below to find specific information within the annual report.-
 1
1 -
2
-
3
-
4
-
5
-
6
-
7
-
8
-
9
-
10
-
11
-
12
-
13
-
14
-
15
-
16
-
17
-
18
-
19
-
20
-
21
-
22
-
23
-
24
-
25
-
26
-
27
-
28
-
29
-
30
-
31
-
32
-
33
-
34
-
35
-
36
-
37
-
38
-
39
-
40
-
41
-
42
-
43
-
44
-
45
-
46
-
47
-
48
-
49
-
50
-
51
-
52
-
53
-
54
-
55
-
56
-
57
-
58
-
59
-
60
-
61
-
62
-
63
-
64
-
65
-
66
-
67
-
68
-
69
-
70
-
71
-
72
-
73
-
74
-
75
-
76
-
77
-
78
-
79
-
80
-
81
-
82
-
83
-
84
-
85
-
86
-
87
-
88
-
89
-
90
-
91
-
92
-
93
-
94
-
95
-
96
-
97
-
98
-
99
-
100
-
101
-
102
-
103
-
104
-
105
-
106
-
107
-
108
-
109
-
110
-
111
-
112
-
113
-
114
-
115
-
116
-
117
-
118
-
119
-
120
-
121
-
122
-
123
-
124
-
125
-
126
-
127
-
128
-
129
-
130
-
131
-
132
-
133
-
134
-
135
-
136
-
137
-
138
-
139
-
140
-
141
-
142
-
143
-
144
-
145
-
146
-
147
-
148
-
149
-
150
-
151
-
152
-
153
-
154
-
155
-
156
-
157
-
158
-
159
-
160
-
161
-
162
-
163
-
164
-
165
-
166
-
167
-
168
-
169
-
170
-
171
-
172
-
173
-
174
-
175
-
176
-
177
-
 178
178 -
 179
179 -
 180
180 -
 181
181 -
 182
182 -
 183
183 -
 184
184 -
 185
185 -
 186
186 -
 187
187 -
 188
188 -
 189
189 -
 190
190 -
 191
191 -
 192
192 -
 193
193 -
 194
194 -
 195
195 -
 196
196 -
 197
197 -
 198
198 -
199
-
200
-
201
-
202
-
203
-
204
-
205
-
206
-
207
-
208
-
209
-
210
-
211
-
212
-
213
-
214
-
215
-
216
-
217
-
218
-
219
-
220
-
221
-
222
-
223
-
224
-
225
-
226
-
227
-
228
-
229
-
230
-
231
-
232
 |
 |

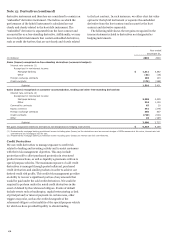
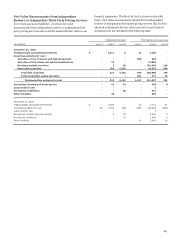
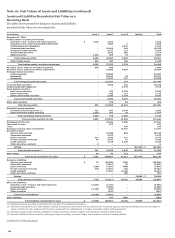
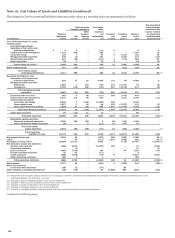
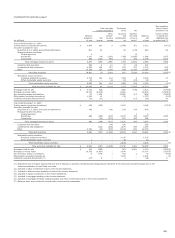
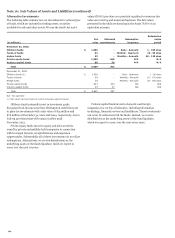
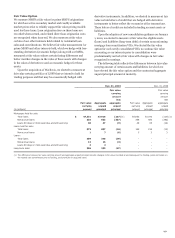
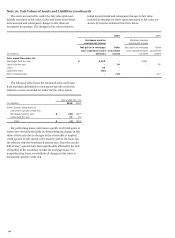
Note 16: Fair Values of Assets and Liabilities (continued)
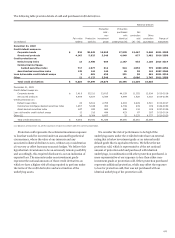
The changes in Level 3 assets and liabilities measured at fair value on a recurring basis are summarized as follows.
Net unrealized
Total net gains
Purchases,
gains (losses)
(losses) included in
sales,
included in net
Other
issuances
income related
Balance,
compre-
and
Transfers
Transfers
Balance,
to assets and
beginning
Net
hensive
settlements,
into
out of
end of
liabilities held
(in millions) of year
income
income
net
Level 3
Level 3
year
at period end
(1)
Year ended December 31, 2010
Trading assets
(excluding derivatives):
Securities of U.S. states and
political subdivisions $ 5
2
-
(11)
9
-
5
1
Collateralized debt obligations 1,133
418
-
364
-
-
1,915
11
Corporate bonds 223
9
-
67
9
(142)
166
16
Mortgage-backed securities 146
(7)
-
101
-
(123)
117
(17)
Asset-backed securities 497
80
-
(141)
1
(71)
366
67
Equity securities 36
1
-
(5)
2
-
34
(2)
Total trading securities 2,040
503
-
375
21
(336)
2,603
76
Other trading assets 271
(35)
-
(19)
-
(81)
136
10
Total trading assets
(excluding derivatives) 2,311
468
-
356
21
(417)
2,739
86
(2)
Securities available for sale:
Securities of U.S. states and
political subdivisions 818
12
63
3,485
192
(6)
4,564
4
Mortgage-backed securities:
Residential 1,084
7
(21)
(48)
274
(1,276)
20
(8)
Commercial 1,799
(28)
404
(10)
227
(2,175)
217
(5)
Total mortgage-backed
securities 2,883
(21)
383
(58)
501
(3,451)
237
(13)
Corporate debt securities 367
7
68
(113)
259
(155)
433
-
Collateralized debt obligations 3,725
210
96
959
-
(212)
4,778
(14)
Asset-backed securities:
Auto loans and leases 8,525
1
(246)
(2,403)
256
-
6,133
-
Home equity loans 1,677
1
40
48
113
(1,767)
112
(5)
Other asset-backed securities 2,308
51
(19)
903
1,057
(1,150)
3,150
(12)
Total asset-backed securities 12,510
53
(225)
(1,452)
1,426
(2,917)
9,395
(17)
Other debt securities 77
(15)
11
12
-
-
85
-
Total debt securities 20,380
246
396
2,833
2,378
(6,741)
19,492
(40)
(3)
Marketable equity securities:
Perpetual preferred securities 2,305
100
(31)
6
80
(26)
2,434
-
Other marketable equity securities 88
-
5
(21)
14
(54)
32
-
Total marketable
equity securities 2,393
100
(26)
(15)
94
(80)
2,466
-
(4)
Total securities
available for sale 22,773
346
370
2,818
2,472
(6,821)
21,958
(40)
Mortgages held for sale 3,523
43
-
(253)
380
(388)
3,305
39
(5)
Loans -
55
-
(112)
1,035
(669)
309
55
(5)
Mortgage servicing rights 16,004
(5,511)
-
4,092
-
(118)
14,467
(2,957)
(5)
Net derivative assets and liabilities:
Interest rate contracts (114)
3,514
-
(3,482)
159
-
77
(266)
Commodity contracts -
(1)
-
-
-
-
(1)
(1)
Equity contracts (344)
(104)
-
169
-
54
(225)
(19)
Foreign exchange contracts (1)
21
-
(11)
-
-
9
-
Credit contracts (330)
(675)
-
(18)
6
-
(1,017)
(644)
Other derivative contracts (43)
4
-
4
-
-
(35)
-
Total derivative contracts (832)
2,759
-
(3,338)
165
54
(1,192)
(930)
(6)
Other assets 1,373
29
-
(103)
4
(989)
314
(38)
(2)
Short sale liabilities
(corporate debt securities) (26)
(2)
-
(37)
-
65
-
-
Other liabilities (excluding derivatives) (10)
(55)
-
94
(1,038)
665
(344)
(58)
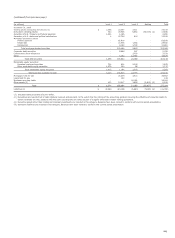
(1) Represents only net gains (losses) that are due to changes in economic conditions and management’s estimates of fair value and excludes changes due to the
collection/realization of cash flows over time.
(2) Included in other noninterest income in the income statement.
(3) Included in debt securities available for sale in the income statement.
(4) Included in equity investments in the income statement.
(5) Included in mortgage banking in the income statement.
(6) Included in mortgage banking, trading activities and other noninterest income in the income statement.
(continued on following page)
186