Wells Fargo 2010 Annual Report Download - page 176
Download and view the complete annual report
Please find page 176 of the 2010 Wells Fargo annual report below. You can navigate through the pages in the report by either clicking on the pages listed below, or by using the keyword search tool below to find specific information within the annual report.-
 1
1 -
2
-
3
-
4
-
5
-
6
-
7
-
8
-
9
-
10
-
11
-
12
-
13
-
14
-
15
-
16
-
17
-
18
-
19
-
20
-
21
-
22
-
23
-
24
-
25
-
26
-
27
-
28
-
29
-
30
-
31
-
32
-
33
-
34
-
35
-
36
-
37
-
38
-
39
-
40
-
41
-
42
-
43
-
44
-
45
-
46
-
47
-
48
-
49
-
50
-
51
-
52
-
53
-
54
-
55
-
56
-
57
-
58
-
59
-
60
-
61
-
62
-
63
-
64
-
65
-
66
-
67
-
68
-
69
-
70
-
71
-
72
-
73
-
74
-
75
-
76
-
77
-
78
-
79
-
80
-
81
-
82
-
83
-
84
-
85
-
86
-
87
-
88
-
89
-
90
-
91
-
92
-
93
-
94
-
95
-
96
-
97
-
98
-
99
-
100
-
101
-
102
-
103
-
104
-
105
-
106
-
107
-
108
-
109
-
110
-
111
-
112
-
113
-
114
-
115
-
116
-
117
-
118
-
119
-
120
-
121
-
122
-
123
-
124
-
125
-
126
-
127
-
128
-
129
-
130
-
131
-
132
-
133
-
134
-
135
-
136
-
137
-
138
-
139
-
140
-
141
-
142
-
143
-
144
-
145
-
146
-
147
-
148
-
149
-
150
-
151
-
152
-
153
-
154
-
155
-
156
-
157
-
158
-
159
-
160
-
161
-
162
-
163
-
164
-
165
-
 166
166 -
 167
167 -
 168
168 -
 169
169 -
 170
170 -
 171
171 -
 172
172 -
 173
173 -
 174
174 -
 175
175 -
 176
176 -
 177
177 -
 178
178 -
 179
179 -
 180
180 -
 181
181 -
 182
182 -
 183
183 -
 184
184 -
 185
185 -
 186
186 -
187
-
188
-
189
-
190
-
191
-
192
-
193
-
194
-
195
-
196
-
197
-
198
-
199
-
200
-
201
-
202
-
203
-
204
-
205
-
206
-
207
-
208
-
209
-
210
-
211
-
212
-
213
-
214
-
215
-
216
-
217
-
218
-
219
-
220
-
221
-
222
-
223
-
224
-
225
-
226
-
227
-
228
-
229
-
230
-
231
-
232
 |
 |

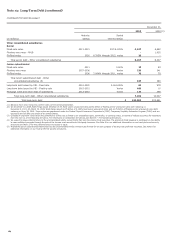
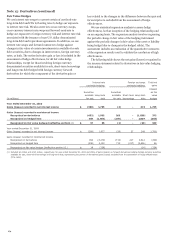
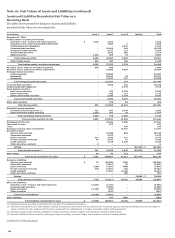
Note 15: Derivatives (continued)
Fair Value Hedges
We use interest rate swaps to convert certain of our fixed-rate
long-term debt and CDs to floating rates to hedge our exposure
to interest rate risk. We also enter into cross-currency swaps,
cross-currency interest rate swaps and forward contracts to
hedge our exposure to foreign currency risk and interest rate risk
associated with the issuance of non-U.S. dollar denominated
long-term debt and repurchase agreements. In addition, we use
interest rate swaps and forward contracts to hedge against
changes in fair value of certain investments in available-for-sale
debt securities, due to changes in interest rates, foreign currency
rates, or both. The entire derivative gain or loss is included in the
assessment of hedge effectiveness, for all fair value hedge
relationships, except for those involving foreign-currency
denominated securities available for sale, short-term borrowings
and long-term debt hedged with foreign currency forward
derivatives for which the component of the derivative gain or
loss related to the changes in the difference between the spot and
forward price is excluded from the assessment of hedge
effectiveness.
We use statistical regression analysis to assess hedge
effectiveness, both at inception of the hedging relationship and
on an ongoing basis. The regression analysis involves regressing
the periodic change in fair value of the hedging instrument
against the periodic changes in fair value of the asset or liability
being hedged due to changes in the hedged risk(s). The
assessment includes an evaluation of the quantitative measures
of the regression results used to validate the conclusion of high
effectiveness.
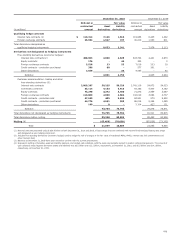
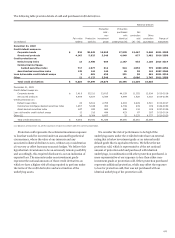
The following table shows the net gains (losses) recognized in
the income statement related to derivatives in fair value hedging
relationships.
Interest rate
Foreign exchange
Total net
contracts hedging:
contracts hedging:
gains
(losses)
Securities
Securities
on fair
available
Long-term
available
Short-term
Long-term
value
(in millions) for sale
debt
for sale
borrowings
debt
hedges
Year ended December 31, 2010
Gains (losses) recorded in net interest income $ (390)
1,755
(4)
-
374
1,735
Gains (losses) recorded in noninterest income
Recognized on derivatives (432)
1,565
269
-
(1,030)
372
Recognized on hedged item 469
(1,469)
(270)
-
1,007
(263)
Recognized on fair value hedges (ineffective portion) (1) $ 37
96
(1)
-
(23)
109
Year ended December 31, 2009
Gains (losses) recorded in net interest income $ (289)
1,677
(56)
27
349
1,708
Gains (losses) recorded in noninterest income
Recognized on derivatives 954
(3,270)
(713)
217
2,612
(200)
Recognized on hedged item (936)
3,132
713
(217)
(2,626)
66
Recognized on fair value hedges (ineffective portion) (1) $ 18
(138)
-
-
(14)
(134)
(1) Included $3 million and $(10) million, respectively, for year ended December 31, 2010 and 2009, of gains (losses) on forward derivatives hedging foreign currency securities
available for sale, short-term borrowings and long-term debt, representing the portion of derivatives gains (losses) excluded from the assessment of hedge effectiveness
(time value).
174