Wells Fargo 2010 Annual Report Download - page 57
Download and view the complete annual report
Please find page 57 of the 2010 Wells Fargo annual report below. You can navigate through the pages in the report by either clicking on the pages listed below, or by using the keyword search tool below to find specific information within the annual report.-
 1
1 -
2
-
3
-
4
-
5
-
6
-
7
-
8
-
9
-
10
-
11
-
12
-
13
-
14
-
15
-
16
-
17
-
18
-
19
-
20
-
21
-
22
-
23
-
24
-
25
-
26
-
27
-
28
-
29
-
30
-
31
-
32
-
33
-
34
-
35
-
36
-
37
-
38
-
39
-
40
-
41
-
42
-
43
-
44
-
45
-
46
-
 47
47 -
 48
48 -
 49
49 -
 50
50 -
 51
51 -
 52
52 -
 53
53 -
 54
54 -
 55
55 -
 56
56 -
 57
57 -
 58
58 -
 59
59 -
 60
60 -
 61
61 -
 62
62 -
 63
63 -
 64
64 -
 65
65 -
 66
66 -
 67
67 -
68
-
69
-
70
-
71
-
72
-
73
-
74
-
75
-
76
-
77
-
78
-
79
-
80
-
81
-
82
-
83
-
84
-
85
-
86
-
87
-
88
-
89
-
90
-
91
-
92
-
93
-
94
-
95
-
96
-
97
-
98
-
99
-
100
-
101
-
102
-
103
-
104
-
105
-
106
-
107
-
108
-
109
-
110
-
111
-
112
-
113
-
114
-
115
-
116
-
117
-
118
-
119
-
120
-
121
-
122
-
123
-
124
-
125
-
126
-
127
-
128
-
129
-
130
-
131
-
132
-
133
-
134
-
135
-
136
-
137
-
138
-
139
-
140
-
141
-
142
-
143
-
144
-
145
-
146
-
147
-
148
-
149
-
150
-
151
-
152
-
153
-
154
-
155
-
156
-
157
-
158
-
159
-
160
-
161
-
162
-
163
-
164
-
165
-
166
-
167
-
168
-
169
-
170
-
171
-
172
-
173
-
174
-
175
-
176
-
177
-
178
-
179
-
180
-
181
-
182
-
183
-
184
-
185
-
186
-
187
-
188
-
189
-
190
-
191
-
192
-
193
-
194
-
195
-
196
-
197
-
198
-
199
-
200
-
201
-
202
-
203
-
204
-
205
-
206
-
207
-
208
-
209
-
210
-
211
-
212
-
213
-
214
-
215
-
216
-
217
-
218
-
219
-
220
-
221
-
222
-
223
-
224
-
225
-
226
-
227
-
228
-
229
-
230
-
231
-
232
 |
 |
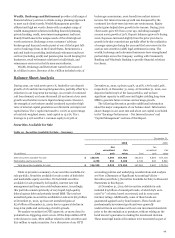
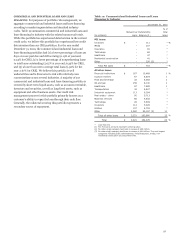
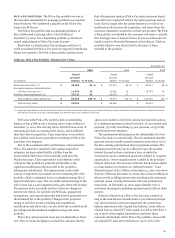
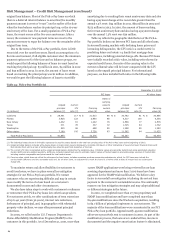
COMMERCIAL REAL ESTATE (CRE) The CRE portfolio consists
of both CRE mortgages and CRE construction loans. The
combined CRE loans outstanding totaled $124.8 billion at
December 31, 2010, or 16% of total loans. Of the $124.8 billion,
approximately $5.8 billion represents the net balance of PCI
CRE loans. CRE construction loans totaled $25.3 billion at
December 31, 2010, or 3% of total loans. CRE mortgage loans
totaled $99.4 billion at December 31, 2010, or 13% of total
loans, of which over 40% is to owner-occupants, who
historically have a low level of default. The portfolio is
diversified both geographically and by property type. The
largest geographic concentrations are found in California and
Florida, which represented 23% and 11% of the total CRE
portfolio, respectively. By property type, the largest
concentrations are office buildings at 23% and
industrial/warehouse at 11% of the portfolio.
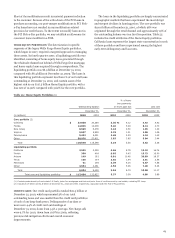
The underwriting of CRE loans primarily focuses on cash
flows and creditworthiness, in addition to collateral valuations.
To identify and manage newly emerging problem CRE loans,
we employ a high level of surveillance and regular customer
interaction to understand and manage the risks associated with
these assets, including regular loan reviews and appraisal
updates. As issues are identified, management is engaged and
dedicated workout groups are put in place to manage problem
assets. At December 31, 2010, the recorded investment in PCI
CRE loans totaled $5.8 billion, down from $12.3 billion since
the Wachovia acquisition at December 31, 2008, reflecting the
reduction resulting from loan resolutions and write-downs.
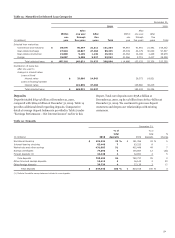
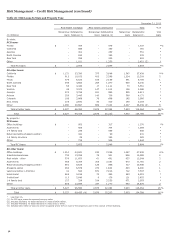
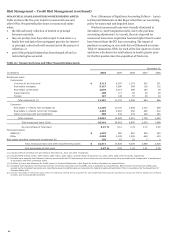
Table 18 summarizes CRE loans by state and property type
with the related nonaccrual totals. At December 31, 2010, the
highest concentration of total loans by state was $28.2 billion
in California, more than double the next largest state
concentration, and the related nonaccrual loans totaled about
$1.5 billion, or 5% of CRE loans in California. Office buildings,
at $28.7 billion, were the largest property type concentration,
more than double the next largest, and the related nonaccrual
loans totaled $1.4 billion, or 5% of total CRE loans for office
buildings. In aggregate, nonaccrual loans totaled 7% of the
non-PCI outstanding balance at December 31, 2010.
55