Wells Fargo 2010 Annual Report Download - page 216
Download and view the complete annual report
Please find page 216 of the 2010 Wells Fargo annual report below. You can navigate through the pages in the report by either clicking on the pages listed below, or by using the keyword search tool below to find specific information within the annual report.-
 1
1 -
2
-
3
-
4
-
5
-
6
-
7
-
8
-
9
-
10
-
11
-
12
-
13
-
14
-
15
-
16
-
17
-
18
-
19
-
20
-
21
-
22
-
23
-
24
-
25
-
26
-
27
-
28
-
29
-
30
-
31
-
32
-
33
-
34
-
35
-
36
-
37
-
38
-
39
-
40
-
41
-
42
-
43
-
44
-
45
-
46
-
47
-
48
-
49
-
50
-
51
-
52
-
53
-
54
-
55
-
56
-
57
-
58
-
59
-
60
-
61
-
62
-
63
-
64
-
65
-
66
-
67
-
68
-
69
-
70
-
71
-
72
-
73
-
74
-
75
-
76
-
77
-
78
-
79
-
80
-
81
-
82
-
83
-
84
-
85
-
86
-
87
-
88
-
89
-
90
-
91
-
92
-
93
-
94
-
95
-
96
-
97
-
98
-
99
-
100
-
101
-
102
-
103
-
104
-
105
-
106
-
107
-
108
-
109
-
110
-
111
-
112
-
113
-
114
-
115
-
116
-
117
-
118
-
119
-
120
-
121
-
122
-
123
-
124
-
125
-
126
-
127
-
128
-
129
-
130
-
131
-
132
-
133
-
134
-
135
-
136
-
137
-
138
-
139
-
140
-
141
-
142
-
143
-
144
-
145
-
146
-
147
-
148
-
149
-
150
-
151
-
152
-
153
-
154
-
155
-
156
-
157
-
158
-
159
-
160
-
161
-
162
-
163
-
164
-
165
-
166
-
167
-
168
-
169
-
170
-
171
-
172
-
173
-
174
-
175
-
176
-
177
-
178
-
179
-
180
-
181
-
182
-
183
-
184
-
185
-
186
-
187
-
188
-
189
-
190
-
191
-
192
-
193
-
194
-
195
-
196
-
197
-
198
-
199
-
200
-
201
-
202
-
203
-
204
-
205
-
 206
206 -
 207
207 -
 208
208 -
 209
209 -
 210
210 -
 211
211 -
 212
212 -
 213
213 -
 214
214 -
 215
215 -
 216
216 -
 217
217 -
 218
218 -
 219
219 -
 220
220 -
 221
221 -
 222
222 -
 223
223 -
 224
224 -
 225
225 -
 226
226 -
227
-
228
-
229
-
230
-
231
-
232
 |
 |

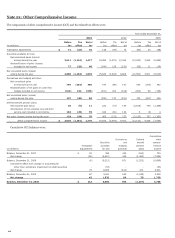
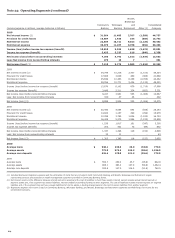
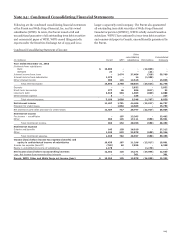
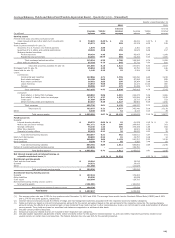
Note 23: Operating Segments (continued)
Wealth,
Brokerage
Community
Wholesale
and
Consolidated
(income/expense in millions, average balances in billions) Banking
Banking
Retirement
Other (1)
Company
2010
Net interest income (2) $ 31,864
11,495
2,707
(1,309)
44,757
Provision for credit losses 13,807
1,920
334
(308)
15,753
Noninterest income 22,834
10,721
9,023
(2,125)
40,453
Noninterest expense 30,073
11,267
9,768
(652)
50,456
Income (loss) before income tax expense (benefit) 10,818
9,029
1,628
(2,474)
19,001
Income tax expense (benefit) 3,425
3,237
616
(940)
6,338
Net income (loss) before noncontrolling interests 7,393
5,792
1,012
(1,534)
12,663
Less: Net income from noncontrolling interests 275
19
7
-
301
Net income (loss) (3) $ 7,118
5,773
1,005
(1,534)
12,362
2009
Net interest income (2) $ 34,799
10,218
2,407
(1,100)
46,324
Provision for credit losses 17,866
3,648
460
(306)
21,668
Noninterest income 25,699
10,363
8,358
(2,058)
42,362
Noninterest expense 29,956
10,771
9,426
(1,133)
49,020
Income (loss) before income tax expense (benefit) 12,676
6,162
879
(1,719)
17,998
Income tax expense (benefit) 3,449
2,211
324
(653)
5,331
Net income (loss) before noncontrolling interests 9,227
3,951
555
(1,066)
12,667
Less: Net income from noncontrolling interests 339
27
26
-
392
Net income (loss) (3) $ 8,888
3,924
529
(1,066)
12,275
2008
Net interest income (2) $ 20,492
4,564
642
(555)
25,143
Provision for credit losses 14,822
1,157
299
(299)
15,979
Noninterest income 12,298
3,785
1,834
(1,183)
16,734
Noninterest expense 16,429
5,375
1,986
(1,192)
22,598
Income (loss) before income tax expense (benefit) 1,539
1,817
191
(247)
3,300
Income tax expense (benefit) 202
421
73
(94)
602
Net income (loss) before noncontrolling interests 1,337
1,396
118
(153)
2,698
Less: Net income from noncontrolling interests 32
11
-
-
43
Net income (loss) (3) $ 1,305
1,385
118
(153)
2,655
2010
Average loans $ 530.1
230.5
43.0
(33.0)
770.6
Average assets 773.0
373.2
139.3
(58.6)
1,226.9
Average core deposits 536.4
170.0
121.2
(55.6)
772.0
2009
Average loans $ 552.7
260.2
45.7
(35.8)
822.8
Average assets 806.1
383.2
127.9
(54.8)
1,262.4
Average core deposits 552.8
147.3
114.2
(51.8)
762.5
(1) Includes Wachovia integration expenses and the elimination of items that are included in both Community Banking and Wealth, Brokerage and Retirement, largely
representing services and products for wealth management customers provided in Community Banking stores.
(2) Net interest income is the difference between interest earned on assets and the cost of liabilities to fund those assets. Interest earned includes actual interest earned on
segment assets and, if the segment has excess liabilities, interest credits for providing funding to other segments. The cost of liabilities includes interest expense on segment
liabilities and, if the segment does not have enough liabilities to fund its assets, a funding charge based on the cost of excess liabilities from another segment.
(3) Represents segment net income (loss) for Community Banking; Wholesale Banking; and Wealth, Brokerage and Retirement segments and Wells Fargo net income for the
consolidated company.
214