Wells Fargo 2010 Annual Report Download - page 39
Download and view the complete annual report
Please find page 39 of the 2010 Wells Fargo annual report below. You can navigate through the pages in the report by either clicking on the pages listed below, or by using the keyword search tool below to find specific information within the annual report.-
 1
1 -
2
-
3
-
4
-
5
-
6
-
7
-
8
-
9
-
10
-
11
-
12
-
13
-
14
-
15
-
16
-
17
-
18
-
19
-
20
-
21
-
22
-
23
-
24
-
25
-
26
-
27
-
28
-
 29
29 -
 30
30 -
 31
31 -
 32
32 -
 33
33 -
 34
34 -
 35
35 -
 36
36 -
 37
37 -
 38
38 -
 39
39 -
 40
40 -
 41
41 -
 42
42 -
 43
43 -
 44
44 -
 45
45 -
 46
46 -
 47
47 -
 48
48 -
 49
49 -
50
-
51
-
52
-
53
-
54
-
55
-
56
-
57
-
58
-
59
-
60
-
61
-
62
-
63
-
64
-
65
-
66
-
67
-
68
-
69
-
70
-
71
-
72
-
73
-
74
-
75
-
76
-
77
-
78
-
79
-
80
-
81
-
82
-
83
-
84
-
85
-
86
-
87
-
88
-
89
-
90
-
91
-
92
-
93
-
94
-
95
-
96
-
97
-
98
-
99
-
100
-
101
-
102
-
103
-
104
-
105
-
106
-
107
-
108
-
109
-
110
-
111
-
112
-
113
-
114
-
115
-
116
-
117
-
118
-
119
-
120
-
121
-
122
-
123
-
124
-
125
-
126
-
127
-
128
-
129
-
130
-
131
-
132
-
133
-
134
-
135
-
136
-
137
-
138
-
139
-
140
-
141
-
142
-
143
-
144
-
145
-
146
-
147
-
148
-
149
-
150
-
151
-
152
-
153
-
154
-
155
-
156
-
157
-
158
-
159
-
160
-
161
-
162
-
163
-
164
-
165
-
166
-
167
-
168
-
169
-
170
-
171
-
172
-
173
-
174
-
175
-
176
-
177
-
178
-
179
-
180
-
181
-
182
-
183
-
184
-
185
-
186
-
187
-
188
-
189
-
190
-
191
-
192
-
193
-
194
-
195
-
196
-
197
-
198
-
199
-
200
-
201
-
202
-
203
-
204
-
205
-
206
-
207
-
208
-
209
-
210
-
211
-
212
-
213
-
214
-
215
-
216
-
217
-
218
-
219
-
220
-
221
-
222
-
223
-
224
-
225
-
226
-
227
-
228
-
229
-
230
-
231
-
232
 |
 |

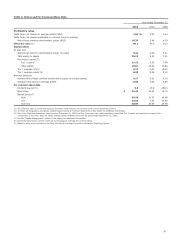
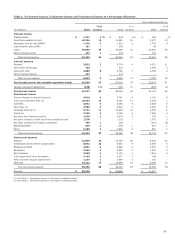
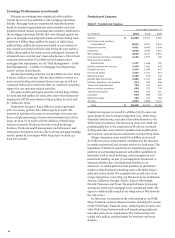
Table 2: Ratios and Per Common Share Data
Year ended December 31,
2010
2009
2008
Profitability ratios
Wells Fargo net income to average assets (ROA)
1.01
%
0.97
0.44
Wells Fargo net income applicable to common stock to average
Wells Fargo common stockholders' equity (ROE)
10.33
9.88
4.79
Efficiency ratio (1)
59.2
55.3
54.0
Capital ratios
At year end:
Wells Fargo common stockholders' equity to assets
9.41
8.34
5.21
Total equity to assets
10.16
9.20
7.81
Risk-based capital (2)
Tier 1 capital
11.16
9.25
7.84
Total capital
15.01
13.26
11.83
Tier 1 leverage (2)(3)
9.19
7.87
14.52
Tier 1 common equity (4)
8.30
6.46
3.13
Average balances:
Average Wells Fargo common stockholders' equity to average assets
9.17
6.41
8.18
Average total equity to average assets
9.96
9.34
8.89
Per common share data
Dividend payout (5)
9.0
27.9
185.4
Book value $
22.49
20.03
16.15
Market price (6)
High
34.25
31.53
44.68
Low
23.02
7.80
19.89
Year end
30.99
26.99
29.48
(1)
The efficiency ratio is noninterest expense divided by total revenue (net interest income and noninterest income).
(2) See Note 25 (Regulatory and Agency Capital Requirements) to Financial Statements in this Report for additional information.
(3) Due to the Wachovia transaction that closed on December 31, 2008, the Tier 1 leverage ratio, which considers period-end Tier 1 capital and quarterly averages in the
computation of the ratio, does not reflect average assets of Wachovia for the full period ended December 31, 2008.
(4) See the "Capital Management" section in this Report for additional information.
(5) Dividends declared per common share as a percentage of earnings per common share.
(6) Based on daily prices reported on the New York Stock Exchange Composite Transaction Reporting System.
37