Wells Fargo 2010 Annual Report Download - page 40
Download and view the complete annual report
Please find page 40 of the 2010 Wells Fargo annual report below. You can navigate through the pages in the report by either clicking on the pages listed below, or by using the keyword search tool below to find specific information within the annual report.-
 1
1 -
2
-
3
-
4
-
5
-
6
-
7
-
8
-
9
-
10
-
11
-
12
-
13
-
14
-
15
-
16
-
17
-
18
-
19
-
20
-
21
-
22
-
23
-
24
-
25
-
26
-
27
-
28
-
29
-
 30
30 -
 31
31 -
 32
32 -
 33
33 -
 34
34 -
 35
35 -
 36
36 -
 37
37 -
 38
38 -
 39
39 -
 40
40 -
 41
41 -
 42
42 -
 43
43 -
 44
44 -
 45
45 -
 46
46 -
 47
47 -
 48
48 -
 49
49 -
 50
50 -
51
-
52
-
53
-
54
-
55
-
56
-
57
-
58
-
59
-
60
-
61
-
62
-
63
-
64
-
65
-
66
-
67
-
68
-
69
-
70
-
71
-
72
-
73
-
74
-
75
-
76
-
77
-
78
-
79
-
80
-
81
-
82
-
83
-
84
-
85
-
86
-
87
-
88
-
89
-
90
-
91
-
92
-
93
-
94
-
95
-
96
-
97
-
98
-
99
-
100
-
101
-
102
-
103
-
104
-
105
-
106
-
107
-
108
-
109
-
110
-
111
-
112
-
113
-
114
-
115
-
116
-
117
-
118
-
119
-
120
-
121
-
122
-
123
-
124
-
125
-
126
-
127
-
128
-
129
-
130
-
131
-
132
-
133
-
134
-
135
-
136
-
137
-
138
-
139
-
140
-
141
-
142
-
143
-
144
-
145
-
146
-
147
-
148
-
149
-
150
-
151
-
152
-
153
-
154
-
155
-
156
-
157
-
158
-
159
-
160
-
161
-
162
-
163
-
164
-
165
-
166
-
167
-
168
-
169
-
170
-
171
-
172
-
173
-
174
-
175
-
176
-
177
-
178
-
179
-
180
-
181
-
182
-
183
-
184
-
185
-
186
-
187
-
188
-
189
-
190
-
191
-
192
-
193
-
194
-
195
-
196
-
197
-
198
-
199
-
200
-
201
-
202
-
203
-
204
-
205
-
206
-
207
-
208
-
209
-
210
-
211
-
212
-
213
-
214
-
215
-
216
-
217
-
218
-
219
-
220
-
221
-
222
-
223
-
224
-
225
-
226
-
227
-
228
-
229
-
230
-
231
-
232
 |
 |

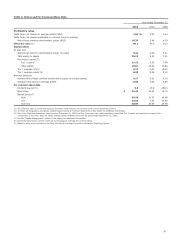
Net income for 2010 was $12.4 billion ($2.21 diluted per share)
with $11.6 billion applicable to common stock, compared with
net income of $12.3 billion ($1.75 diluted per share) with
$8.0 billion applicable to common stock for 2009. Preferred
stock dividends and accretion of preferred stock discount
included $3.5 billion in 2009 for Series D preferred stock issued
to the U.S. Treasury Department in 2008, which reduced 2009
diluted earnings by $0.76 per share. These preferred shares were
redeemed December 23, 2009, when we repaid the U.S.
Treasury Department’s TARP preferred stock investment.
Earnings Performance
Our 2010 earnings were influenced by a slow recovery from
the recession that dominated 2009 and most of 2008 and by a
continuation of a low rate environment. These economic
conditions caused declining loan demand, solid deposit
generation and continued elevated credit losses. Earnings for
2009 were influenced by the worsening of the recession that
began in 2008, and low market rates. Both 2010 and 2009 were
affected by merger integration costs.
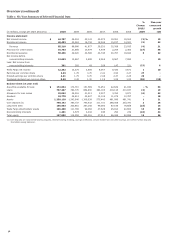
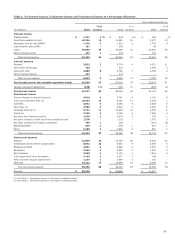
Revenue, the sum of net interest income and noninterest
income, was $85.2 billion in 2010 compared with $88.7 billion
in 2009 and $41.9 billion in 2008. In 2010, net interest income
of $44.8 billion represented 53% of revenue, compared with
$46.3 billion (52%) in 2009 and $25.1 billion (60%) in 2008.
Noninterest income was relatively stable in 2010 at
$40.5 billion, representing 47% of revenue, compared with
$42.4 billion (48%) in 2009 and $16.7 billion (40%) in 2008.
The increase in 2009 to 48% from 40% in 2008 was primarily
due to a higher percentage of trust and investment fees (11% in
2009, up from 7% in 2008) and very strong mortgage banking
results (14% in 2009, up from 6% in 2008, predominantly from
legacy Wells Fargo).
Noninterest expense was $50.5 billion in 2010, compared
with $49.0 billion in 2009 and $22.6 billion in 2008.
Noninterest expense as a percentage of revenue was 59% in
2010, 55% in 2009 and 54% in 2008. Noninterest expense for
2010 included $1.9 billion of Wachovia merger-related
integration expense compared with $895 million in 2009.
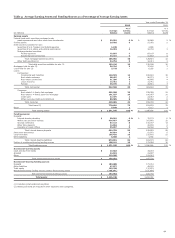
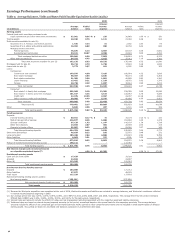
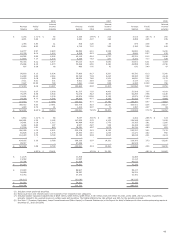
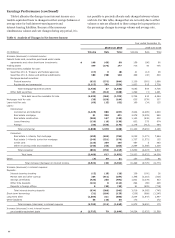
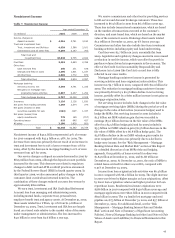
Table 3 presents the components of revenue and noninterest
expense as a percentage of revenue for year-over-year results.
38