Wells Fargo 2010 Annual Report Download - page 64
Download and view the complete annual report
Please find page 64 of the 2010 Wells Fargo annual report below. You can navigate through the pages in the report by either clicking on the pages listed below, or by using the keyword search tool below to find specific information within the annual report.-
 1
1 -
2
-
3
-
4
-
5
-
6
-
7
-
8
-
9
-
10
-
11
-
12
-
13
-
14
-
15
-
16
-
17
-
18
-
19
-
20
-
21
-
22
-
23
-
24
-
25
-
26
-
27
-
28
-
29
-
30
-
31
-
32
-
33
-
34
-
35
-
36
-
37
-
38
-
39
-
40
-
41
-
42
-
43
-
44
-
45
-
46
-
47
-
48
-
49
-
50
-
51
-
52
-
53
-
 54
54 -
 55
55 -
 56
56 -
 57
57 -
 58
58 -
 59
59 -
 60
60 -
 61
61 -
 62
62 -
 63
63 -
 64
64 -
 65
65 -
 66
66 -
 67
67 -
 68
68 -
 69
69 -
 70
70 -
 71
71 -
 72
72 -
 73
73 -
 74
74 -
75
-
76
-
77
-
78
-
79
-
80
-
81
-
82
-
83
-
84
-
85
-
86
-
87
-
88
-
89
-
90
-
91
-
92
-
93
-
94
-
95
-
96
-
97
-
98
-
99
-
100
-
101
-
102
-
103
-
104
-
105
-
106
-
107
-
108
-
109
-
110
-
111
-
112
-
113
-
114
-
115
-
116
-
117
-
118
-
119
-
120
-
121
-
122
-
123
-
124
-
125
-
126
-
127
-
128
-
129
-
130
-
131
-
132
-
133
-
134
-
135
-
136
-
137
-
138
-
139
-
140
-
141
-
142
-
143
-
144
-
145
-
146
-
147
-
148
-
149
-
150
-
151
-
152
-
153
-
154
-
155
-
156
-
157
-
158
-
159
-
160
-
161
-
162
-
163
-
164
-
165
-
166
-
167
-
168
-
169
-
170
-
171
-
172
-
173
-
174
-
175
-
176
-
177
-
178
-
179
-
180
-
181
-
182
-
183
-
184
-
185
-
186
-
187
-
188
-
189
-
190
-
191
-
192
-
193
-
194
-
195
-
196
-
197
-
198
-
199
-
200
-
201
-
202
-
203
-
204
-
205
-
206
-
207
-
208
-
209
-
210
-
211
-
212
-
213
-
214
-
215
-
216
-
217
-
218
-
219
-
220
-
221
-
222
-
223
-
224
-
225
-
226
-
227
-
228
-
229
-
230
-
231
-
232
 |
 |

Risk Management – Credit Risk Management (continued)
original loan balance. Most of the Pick-a-Pay loans on which
there is a deferred interest balance re-amortize (the monthly
payment amount is reset or “recast”) on the earlier of the date
when the loan balance reaches its principal cap, or the 10-year
anniversary of the loan. For a small population of Pick-a-Pay
loans, the recast occurs at the five-year anniversary. After a
recast, the customers’ new payment terms are reset to the
amount necessary to repay the balance over the remainder of the
original loan term.
Due to the terms of the Pick-a-Pay portfolio, there is little
recast risk over the next three years. Based on assumptions of a
flat rate environment, if all eligible customers elect the minimum
payment option 100% of the time and no balances prepay, we
would expect the following balances of loans to recast based on
reaching the principal cap: $3 million in 2011, $4 million in 2012
and $32 million in 2013. In 2010, the amount of loans recast
based on reaching the principal cap was $1 million. In addition,
we would expect the following balances of loans to start fully
amortizing due to reaching their recast anniversary date and also
having a payment change at the recast date greater than the
annual 7.5% reset: $34 million in 2011, $69 million in 2012 and
$275 million in 2013. In 2010, the amount of loans reaching
their recast anniversary date and also having a payment change
over the annual 7.5% reset was $39 million.
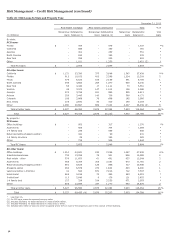
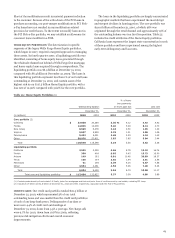
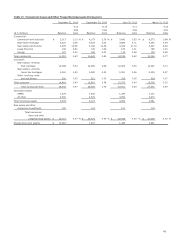
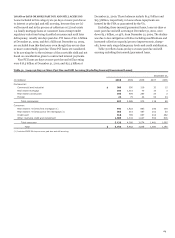
Table 24 reflects the geographic distribution of the Pick-a-
Pay portfolio broken out between PCI loans and all other loans.
In stressed housing markets with declining home prices and
increasing delinquencies, the LTV ratio is a useful metric in
predicting future real estate 1-4 family first mortgage loan
performance, including potential charge-offs. Because PCI loans
were initially recorded at fair value, including write-downs for
expected credit losses, the ratio of the carrying value to the
current collateral value will be lower compared with the LTV
based on the unpaid principal balance. For informational
purposes, we have included both ratios in the following table.
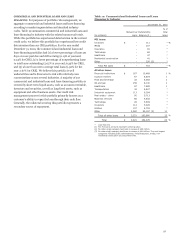
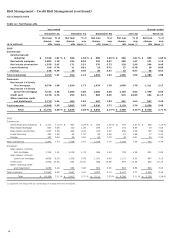
Table 24: Pick-a-Pay Portfolio (1)
December 31, 2010
PCI loans
All other loans
Ratio of
carrying
Unpaid
Current
value to
Unpaid
Current
principal
LTV
Carrying
current
principal
LTV
Carrying
(in millions) balance (2)
ratio (3)
value (4)
value
balance (2)
ratio (3)
value (4)
California $ 28,451
117
%
$ 21,623
88
% $ 20,782
81
% $ 20,866
Florida
3,925
122
2,960
88
4,317
100
4,335
New Jersey
1,432
91
1,242
78
2,568
77
2,578
Texas
371
78
337
72
1,725
64
1,732
Washington
525
96
488
89
1,288
80
1,293
Other states
7,189
106
5,726
83
11,587
84
11,635
Total Pick-a-Pay loans $ 41,893
$ 32,376
$ 42,267
$ 42,439
(1)
The individual states shown in this table represent the top five states based on the total net carrying value of the Pick-a-Pay loans at the beginning of 2010.
(2) Unpaid principal balance includes write-downs taken on loans where severe delinquency (normally 180 days) or other indications of severe borrower financial stress exist
that indicate there will be a loss of contractually due amounts upon final resolution of the loan.
(3) The current LTV ratio is calculated as the unpaid principal balance divided by the collateral value. Collateral values are generally determined using automated valuation
models (AVM) and are updated quarterly. AVMs are computer-based tools used to estimate market values of homes based on processing large volumes of market data
including market comparables and price trends for local market areas.
(4) Carrying value, which does not reflect the allowance for loan losses, includes remaining purchase accounting adjustments, which, for PCI loans may include the
nonaccretable difference and the accretable yield and, for all other loans, an adjustment to mark the loans to a market yield at date of merger less any subsequent
charge-offs.
To maximize return and allow flexibility for customers to
avoid foreclosure, we have in place several loss mitigation
strategies for our Pick-a-Pay loan portfolio. We contact
customers who are experiencing difficulty and may in certain
cases modify the terms of a loan based on a customer’s
documented income and other circumstances.
We also have taken steps to work with customers to refinance
or restructure their Pick-a-Pay loans into other loan products.
For customers at risk, we offer combinations of term extensions
of up to 40 years (from 30 years), interest rate reductions,
forbearance of principal, and, in geographies with substantial
property value declines, we may offer permanent principal
reductions.
In 2009, we rolled out the U.S. Treasury Department’s
Home Affordability Modification Program (HAMP) to the
customers in this portfolio. As of December 31, 2010, more than
11,000 HAMP applications were being reviewed by our loan
servicing department and more than 7,000 loans have been
approved for the HAMP trial modification. We believe a key
factor to successful loss mitigation is tailoring the revised loan
payment to the customer’s sustainable income. We continually
reassess our loss mitigation strategies and may adopt additional
or different strategies in the future.
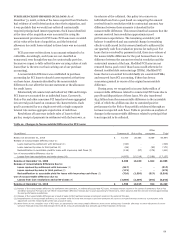
In 2010, we completed more than 27,700 proprietary and
HAMP loan modifications and have completed more than
80,400 modifications since the Wachovia acquisition, resulting
in $3.7 billion of principal forgiveness to our customers. The
majority of the loan modifications were concentrated in our PCI
Pick-a-Pay loan portfolio. Approximately 49,000 modification
offers were proactively sent to customers in 2010. As part of the
modification process, the loans are re-underwritten, income is
documented and the negative amortization feature is eliminated.
62