Wells Fargo 2010 Annual Report Download - page 68
Download and view the complete annual report
Please find page 68 of the 2010 Wells Fargo annual report below. You can navigate through the pages in the report by either clicking on the pages listed below, or by using the keyword search tool below to find specific information within the annual report.-
 1
1 -
2
-
3
-
4
-
5
-
6
-
7
-
8
-
9
-
10
-
11
-
12
-
13
-
14
-
15
-
16
-
17
-
18
-
19
-
20
-
21
-
22
-
23
-
24
-
25
-
26
-
27
-
28
-
29
-
30
-
31
-
32
-
33
-
34
-
35
-
36
-
37
-
38
-
39
-
40
-
41
-
42
-
43
-
44
-
45
-
46
-
47
-
48
-
49
-
50
-
51
-
52
-
53
-
54
-
55
-
56
-
57
-
 58
58 -
 59
59 -
 60
60 -
 61
61 -
 62
62 -
 63
63 -
 64
64 -
 65
65 -
 66
66 -
 67
67 -
 68
68 -
 69
69 -
 70
70 -
 71
71 -
 72
72 -
 73
73 -
 74
74 -
 75
75 -
 76
76 -
 77
77 -
 78
78 -
79
-
80
-
81
-
82
-
83
-
84
-
85
-
86
-
87
-
88
-
89
-
90
-
91
-
92
-
93
-
94
-
95
-
96
-
97
-
98
-
99
-
100
-
101
-
102
-
103
-
104
-
105
-
106
-
107
-
108
-
109
-
110
-
111
-
112
-
113
-
114
-
115
-
116
-
117
-
118
-
119
-
120
-
121
-
122
-
123
-
124
-
125
-
126
-
127
-
128
-
129
-
130
-
131
-
132
-
133
-
134
-
135
-
136
-
137
-
138
-
139
-
140
-
141
-
142
-
143
-
144
-
145
-
146
-
147
-
148
-
149
-
150
-
151
-
152
-
153
-
154
-
155
-
156
-
157
-
158
-
159
-
160
-
161
-
162
-
163
-
164
-
165
-
166
-
167
-
168
-
169
-
170
-
171
-
172
-
173
-
174
-
175
-
176
-
177
-
178
-
179
-
180
-
181
-
182
-
183
-
184
-
185
-
186
-
187
-
188
-
189
-
190
-
191
-
192
-
193
-
194
-
195
-
196
-
197
-
198
-
199
-
200
-
201
-
202
-
203
-
204
-
205
-
206
-
207
-
208
-
209
-
210
-
211
-
212
-
213
-
214
-
215
-
216
-
217
-
218
-
219
-
220
-
221
-
222
-
223
-
224
-
225
-
226
-
227
-
228
-
229
-
230
-
231
-
232
 |
 |

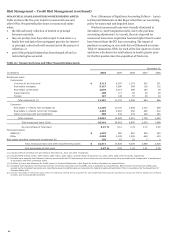
Risk Management – Credit Risk Management (continued)
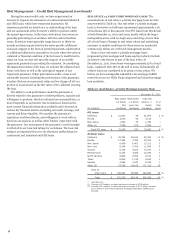
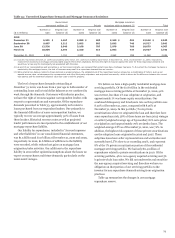
Total NPAs were $32.4 billion (4.27% of total loans) at
December 31, 2010, and included $26.2 billion of nonaccrual
loans and $6.0 billion of foreclosed assets. The growth rate in
nonaccrual loans slowed in 2010, peaking in third quarter.
Growth occurred in the real estate portfolios (commercial and
residential) which consist of secured loans. Nonaccruals in all
other loan portfolios were essentially flat or down year over year.
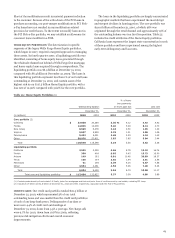
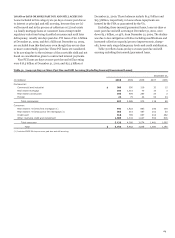
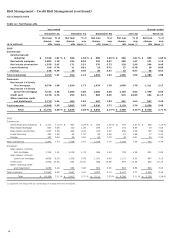
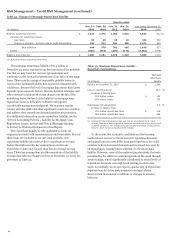
New inflows to nonaccrual loans continued to decline. Table 28
provides an analysis of the changes in nonaccrual loans.
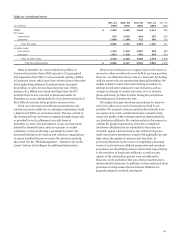
Table 28: Analysis of Changes in Nonaccrual Loans
Quarter ended
Dec. 31,
Sept. 30,
June 30,
Mar. 31,
Dec. 31,
(in millions) 2010
2010
2010
2010
2009
Commercial nonaccrual loans
Balance, beginning of quarter $ 12,644
12,239
12,265
11,723
10,408
Inflows 2,329
2,807
2,560
2,763
3,856
Outflows (3,622)
(2,402)
(2,586)
(2,221)
(2,541)
Balance, end of quarter 11,351
12,644
12,239
12,265
11,723
Consumer nonaccrual loans
Balance, beginning of quarter 15,661
15,572
15,036
12,695
10,461
Inflows 4,357
4,866
4,733
6,169
5,626
Outflows (5,127)
(4,777)
(4,197)
(3,828)
(3,392)
Balance, end of quarter 14,891
15,661
15,572
15,036
12,695
Total nonaccrual loans 26,242
28,305
27,811
27,301
24,418
Typically, changes to nonaccrual loans period-over-period
represent inflows for loans that reach a specified past due
status, offset by reductions for loans that are charged off, sold,
transferred to foreclosed properties, or are no longer classified
as nonaccrual because they return to accrual status. We have
increased our loan modification activity to assist homeowners
and other borrowers in the current difficult economic cycle.
Loans are re-underwritten at the time of the modification in
accordance with underwriting guidelines established for
governmental and proprietary loan modification programs. For
an accruing loan that has been modified, if the borrower has
demonstrated performance under the previous terms and
shows the capacity to continue to perform under the
restructured terms, the loan will remain in accruing status.
Otherwise, the loan will be placed in a nonaccrual status
generally until the borrower has made six consecutive months
of payments, or equivalent, inclusive of consecutive payments
made prior to modification.
Loss expectations for nonaccrual loans are driven by
delinquency rates, default probabilities and severities. While
nonaccrual loans are not free of loss content, we believe the
estimated loss exposure remaining in these balances is
significantly mitigated by four factors. First, 99% of consumer
nonaccrual loans and 95% of commercial nonaccrual loans are
secured. Second, losses have already been recognized on 52%
of the remaining balance of consumer nonaccruals and
commercial nonaccruals have been written down by
$2.6 billion. Residential nonaccrual loans are written down to
net realizable value at 180 days past due, except for loans that
go into trial modification prior to becoming 180 days past due,
and which are not written down in the trial period (three
months) as long as trial payments are being made on time.
Third, as of December 31, 2010, 57% of commercial nonaccrual
loans were current on interest. Fourth, the inherent risk of loss
in all nonaccruals is adequately covered by the allowance for
loan losses.
Commercial nonaccrual loans, net of write-downs,
amounted to $11.4 billion at December 31, 2010, compared
with $11.7 billion a year ago. Consumer nonaccrual loans
amounted to $14.9 billion at December 31, 2010, compared
with $12.7 billion a year ago. The $2.2 billion increase in
nonaccrual consumer loans from a year ago was due to an
increase in 1-4 family first mortgage loans. Residential
mortgage nonaccrual loans increased largely due to slower
disposition and assets brought on the balance sheet upon
consolidation of VIEs. Federal government programs, such as
HAMP, and Wells Fargo proprietary programs, such as the
Company’s Pick-a-Pay Mortgage Assistance program, require
customers to provide updated documentation, and to
demonstrate sustained performance by completing trial
payment periods, before the loan can be removed from
nonaccrual status. In addition, for loans in foreclosure, many
states, including California and Florida, have enacted
legislation that significantly increases the time frames to
complete the foreclosure process, meaning that loans will
remain in nonaccrual status for longer periods. At the
conclusion of the foreclosure process, we continue to sell real
estate owned in a timely fashion.
When a consumer real estate loan is 120 days past due, we
move it to nonaccrual status. When the loan reaches 180 days
past due it is our policy to write these loans down to net
realizable value, except for modifications in their trial period.
Thereafter, we revalue each loan regularly and recognize
additional charges if needed. Of the $14.9 billion of consumer
nonaccrual loans at December 31, 2010, 98% are secured by
real estate and 33% have a combined LTV (CLTV) ratio of 80%
or below.
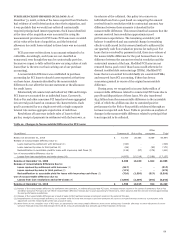
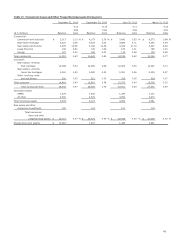
Table 29 provides a summary of foreclosed assets.
66