Safeway 2008 Annual Report Download - page 87
Download and view the complete annual report
Please find page 87 of the 2008 Safeway annual report below. You can navigate through the pages in the report by either clicking on the pages listed below, or by using the keyword search tool below to find specific information within the annual report.-
 1
1 -
2
-
3
-
4
-
5
-
6
-
7
-
8
-
9
-
10
-
11
-
12
-
13
-
14
-
15
-
16
-
17
-
18
-
19
-
20
-
21
-
22
-
23
-
24
-
25
-
26
-
27
-
28
-
29
-
30
-
31
-
32
-
33
-
34
-
35
-
36
-
37
-
38
-
39
-
40
-
41
-
42
-
43
-
44
-
45
-
46
-
47
-
48
-
49
-
50
-
51
-
52
-
53
-
54
-
55
-
56
-
57
-
58
-
59
-
60
-
61
-
62
-
63
-
64
-
65
-
66
-
67
-
68
-
69
-
70
-
71
-
72
-
73
-
74
-
75
-
76
-
 77
77 -
 78
78 -
 79
79 -
 80
80 -
 81
81 -
 82
82 -
 83
83 -
 84
84 -
 85
85 -
 86
86 -
 87
87 -
 88
88 -
 89
89 -
 90
90 -
 91
91 -
 92
92 -
 93
93 -
 94
94 -
 95
95 -
 96
96 -
 97
97 -
98
-
99
-
100
-
101
-
102
-
103
-
104
 |
 |

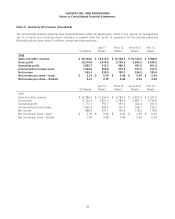
SAFEWAY INC. AND SUBSIDIARIES
Notes to Consolidated Financial Statements
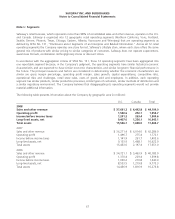
Note L: Segments
Safeway’s retail business, which represents more than 98% of consolidated sales and other revenue, operates in the U.S.
and Canada. Safeway is organized into 12 geographic retail operating segments (Northern California, Vons, Portland,
Seattle, Denver, Phoenix, Texas, Chicago, Eastern, Alberta, Vancouver and Winnipeg) that are operating segments as
defined by SFAS No. 131, “Disclosures about Segments of an Enterprise and Related Information.” Across all 12 retail
operating segments the Company operates one store format, Safeway’s Lifestyle store, where each store offers the same
general mix of products with similar pricing to similar categories of customers. Safeway does not operate supercenters,
warehouse formats, combination clothing/grocery stores or discount stores.
In accordance with the aggregation criteria of SFAS No. 131, these 12 operating segments have been aggregated into
one reportable segment because, in the Company’s judgment, the operating segments have similar historical economic
characteristics and are expected to have similar economic characteristics and similar long-term financial performance in
the future. The principal measures and factors we considered in determining whether the economic characteristics are
similar are gross margin percentage, operating profit margin, sales growth, capital expenditures, competitive risks,
operational risks and challenges, retail store sales, costs of goods sold and employees. In addition, each operating
segment has similar products, similar production processes, similar types of customers, similar methods of distribution and
a similar regulatory environment. The Company believes that disaggregating its operating segments would not provide
material additional information.
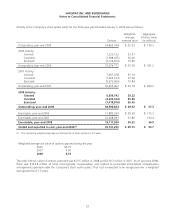
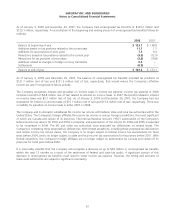
The following table presents information about the Company by geographic area (in millions):
U.S. Canada Total
2008
Sales and other revenue $ 37,661.2 $ 6,442.8 $ 44,104.0
Operating profit 1,580.6 272.1 1,852.7
Income before income taxes 1,241.2 263.4 1,504.6
Long-lived assets, net 9,407.0 1,236.1 10,643.1
Total assets 15,596.7 1,888.0 17,484.7
2007
Sales and other revenue $ 36,271.4 $ 6,014.6 $ 42,286.0
Operating profit 1,496.7 275.4 1,772.1
Income before income taxes 1,141.9 261.7 1,403.6
Long-lived assets, net 9,153.9 1,468.1 10,622.0
Total assets 15,453.6 2,197.4 17,651.0
2006
Sales and other revenue $ 34,721.1 $ 5,463.9 $ 40,185.0
Operating profit 1,370.4 229.4 1,599.8
Income before income taxes 1,029.2 210.8 1,240.0
Long-lived assets, net 8,553.5 1,219.8 9,773.3
Total assets 14,456.9 1,816.9 16,273.8
67