Safeway 2008 Annual Report Download - page 43
Download and view the complete annual report
Please find page 43 of the 2008 Safeway annual report below. You can navigate through the pages in the report by either clicking on the pages listed below, or by using the keyword search tool below to find specific information within the annual report.-
 1
1 -
2
-
3
-
4
-
5
-
6
-
7
-
8
-
9
-
10
-
11
-
12
-
13
-
14
-
15
-
16
-
17
-
18
-
19
-
20
-
21
-
22
-
23
-
24
-
25
-
26
-
27
-
28
-
29
-
30
-
31
-
32
-
 33
33 -
 34
34 -
 35
35 -
 36
36 -
 37
37 -
 38
38 -
 39
39 -
 40
40 -
 41
41 -
 42
42 -
 43
43 -
 44
44 -
 45
45 -
 46
46 -
 47
47 -
 48
48 -
 49
49 -
 50
50 -
 51
51 -
 52
52 -
 53
53 -
54
-
55
-
56
-
57
-
58
-
59
-
60
-
61
-
62
-
63
-
64
-
65
-
66
-
67
-
68
-
69
-
70
-
71
-
72
-
73
-
74
-
75
-
76
-
77
-
78
-
79
-
80
-
81
-
82
-
83
-
84
-
85
-
86
-
87
-
88
-
89
-
90
-
91
-
92
-
93
-
94
-
95
-
96
-
97
-
98
-
99
-
100
-
101
-
102
-
103
-
104
 |
 |
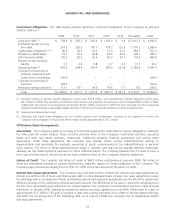
SAFEWAY INC. AND SUBSIDIARIES
dollar exchange rate of $351 million (in U.S. dollars). At the end of 2007, Safeway had 1,024 Lifestyle stores compared to
751 at the end of 2006. Customer counts decreased, and average transaction size increased during fiscal 2007.
Total sales increased 4.6% to $40.2 billion in 2006 from $38.4 billion in 2005 primarily because of Safeway’s marketing
strategy, Lifestyle store execution and an increase in fuel sales of $385 million. At the end of 2006, Safeway had
751 Lifestyle stores compared to 458 at the end of 2005. Customer counts and average transaction size increased during
fiscal 2006.
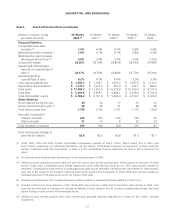
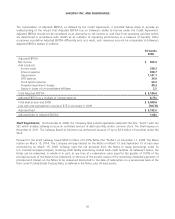
Gross Profit Gross profit represents the portion of sales revenue remaining after deducting the cost of goods sold
during the period, including purchase and distribution costs. These costs include inbound freight charges, purchasing and
receiving costs, warehouse inspection costs, warehousing costs and other costs associated with Safeway’s distribution
network. Advertising and promotional expenses are also a component of cost of goods sold. Additionally, all vendor
allowances are classified as an element of cost of goods sold.
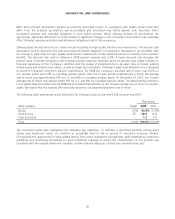
Gross profit margin was 28.38% of sales in 2008, 28.74% in 2007 and 28.82% in 2006.
The gross profit margin declined 36 basis points to 28.38% of sales in 2008 from 28.74% of sales in 2007. Excluding
fuel, gross profit declined 25 basis points primarily because of investments in price and higher LIFO expense, partly offset
by lower advertising expense and improved inventory shrink. LIFO expense was $34.9 million in 2008 compared to
$13.9 million in 2007.
The decline in advertising expense was primarily the result of a more efficient mix of advertising media and may not
necessarily continue in the future. Improved inventory shrink is the result of long-term efforts which we do expect to
continue into the future.
Gross profit decreased eight basis points to 28.74% of sales in 2007 from 28.82% of sales in 2006. Higher fuel sales
reduced gross profit by 20 basis points. Excluding fuel, gross profit increased 12 basis points primarily because of lower
advertising expense, improved shrink and benefits from supply-chain initiatives, partly offset by investments in price and
higher LIFO expense. LIFO expense was $13.9 million in 2007 compared to $1.2 million in 2006.
The decline in advertising expense was primarily the result of a different mix of advertising media. Improved inventory
shrink and supply-chain initiatives are the result of long-term efforts. Supply-chain initiatives consist primarily of Company
programs to reduce cost of goods, transportation and warehouse expenses.
Gross profit decreased 11 basis points to 28.82% of sales in 2006 from 28.93% of sales in 2005. Higher fuel sales
reduced gross profit by 28 basis points. Excluding fuel, gross profit increased 17 basis points, primarily because of
improved shrink, benefits from product-sourcing initiatives and improved product mix, partly offset by investments in
price and increased advertising expense.
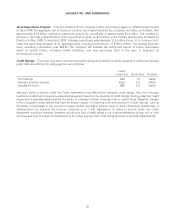
Vendor allowances totaled $2.6 billion in 2008 and $2.5 billion in both 2007 and 2006. Vendor allowances can be
grouped into the following broad categories: promotional allowances, slotting allowances and contract allowances. All
vendor allowances are classified as an element of cost of goods sold.
Promotional allowances make up approximately three-quarters of all allowances. With promotional allowances, vendors
pay Safeway to promote their product. The promotion may be any combination of a temporary price reduction, a feature
in print ads, a feature in a Safeway circular or a preferred location in the store. The promotions are typically one to two
weeks long.
Slotting allowances are a small portion of total allowances (typically less than 5% of all allowances). With slotting
allowances, the vendor reimburses Safeway for the cost of placing new product on the shelf. Safeway has no obligation
or commitment to keep the product on the shelf for a minimum period.
Contract allowances make up the remainder of all allowances. Under the typical contract allowance, a vendor pays
23