Safeway 2008 Annual Report Download - page 71
Download and view the complete annual report
Please find page 71 of the 2008 Safeway annual report below. You can navigate through the pages in the report by either clicking on the pages listed below, or by using the keyword search tool below to find specific information within the annual report.-
 1
1 -
2
-
3
-
4
-
5
-
6
-
7
-
8
-
9
-
10
-
11
-
12
-
13
-
14
-
15
-
16
-
17
-
18
-
19
-
20
-
21
-
22
-
23
-
24
-
25
-
26
-
27
-
28
-
29
-
30
-
31
-
32
-
33
-
34
-
35
-
36
-
37
-
38
-
39
-
40
-
41
-
42
-
43
-
44
-
45
-
46
-
47
-
48
-
49
-
50
-
51
-
52
-
53
-
54
-
55
-
56
-
57
-
58
-
59
-
60
-
 61
61 -
 62
62 -
 63
63 -
 64
64 -
 65
65 -
 66
66 -
 67
67 -
 68
68 -
 69
69 -
 70
70 -
 71
71 -
 72
72 -
 73
73 -
 74
74 -
 75
75 -
 76
76 -
 77
77 -
 78
78 -
 79
79 -
 80
80 -
 81
81 -
82
-
83
-
84
-
85
-
86
-
87
-
88
-
89
-
90
-
91
-
92
-
93
-
94
-
95
-
96
-
97
-
98
-
99
-
100
-
101
-
102
-
103
-
104
 |
 |

SAFEWAY INC. AND SUBSIDIARIES
Notes to Consolidated Financial Statements
In December 2007, the FASB issued SFAS No. 141 (revised 2007), “Business Combinations” (“SFAS No. 141R”). SFAS No. 141R
established principles and requirements for how an entity which obtains control of one or more businesses (1) recognizes and
measures the identifiable assets acquired, the liabilities assumed and any noncontrolling interest in the acquiree, (2) recognizes
and measures the goodwill acquired in the business combination and (3) determines what information to disclose regarding
business combinations. SFAS No. 141R applies prospectively to business combinations for which the acquisition date is on or after
the beginning of the first annual report period beginning on or after December 15, 2008.
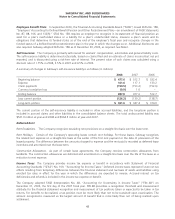
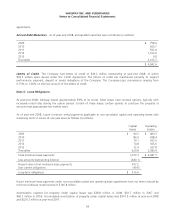
Note B: Goodwill
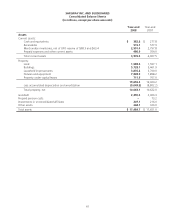
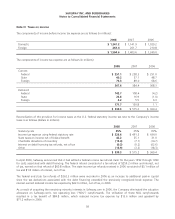
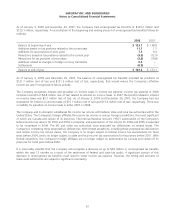
A summary of changes in Safeway’s goodwill during 2008 and 2007 by geographic area is as follows (in millions):
2008 2007
U.S. Canada Total U.S. Canada Total
Balance – beginning of year $ 2,308.8 $ 97.5 $ 2,406.3 $ 2,309.5 $ 84.0 $ 2,393.5
Other adjustments (0.9) (1) (15.2) (2) (16.1) (0.7) (1) 13.5 (2) 12.8
Balance – end of year $ 2,307.9 $ 82.3 $ 2,390.2 $ 2,308.8 $ 97.5 $ 2,406.3
(1) Primarily represents revised estimate of pre-acquisition tax accrual.
(2) Represents foreign currency translation adjustments in Canada.
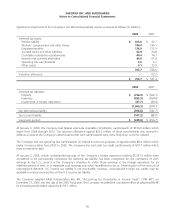
We test goodwill for impairment annually (on the first day of the fourth quarter), or whenever events occur or
circumstances change that would more likely than not reduce the fair value of a reporting unit below its carrying amount,
by initially comparing the fair value of each of our reporting units to their related carrying values. If the fair value of the
reporting unit is less than its carrying value, we perform an additional step to determine the implied fair value of goodwill
associated with that reporting unit. If the carrying value of goodwill exceeds the implied fair value of goodwill, such
excess represents the amount of goodwill impairment. Our goodwill impairment analysis also includes a comparison of
the aggregate estimated fair value of all reporting units to our total market capitalization. Therefore, a significant and
sustained decline in our stock price could result in goodwill impairment charges. During times of financial market
volatility, significant judgment is given to determine the underlying cause of the decline and whether stock price declines
are short-term in nature or indicative of an event or change in circumstances.
Determining the fair value of a reporting unit involves the use of significant estimates and assumptions. The estimate of
fair value of each of our reporting units is based on our projection of sales, gross profit, operating profit and cash flows
considering historical and estimated future results, general economic and market conditions as well as the impact of
planned business and operational strategies. We base our fair value estimates on assumptions we believe to be
reasonable at the time, but such assumptions are subject to inherent uncertainty. Actual results may differ from those
estimates. The valuations employ present value techniques to measure fair value and consider market factors. Based upon
the results of our 2008, 2007 and 2006 analyses, no impairment of goodwill was indicated.
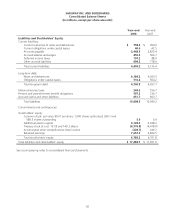
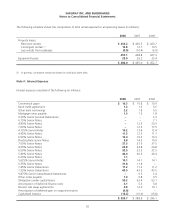
Note C: Store Closing and Impairment Charges
Impairment Write-Downs Safeway recognized impairment charges on the write-down of long-lived assets of
$40.3 million in 2008, $27.1 million in 2007 and $39.2 million in 2006. These charges are included as a component of
operating and administrative expense.
51