Safeway 2008 Annual Report Download - page 47
Download and view the complete annual report
Please find page 47 of the 2008 Safeway annual report below. You can navigate through the pages in the report by either clicking on the pages listed below, or by using the keyword search tool below to find specific information within the annual report.-
 1
1 -
2
-
3
-
4
-
5
-
6
-
7
-
8
-
9
-
10
-
11
-
12
-
13
-
14
-
15
-
16
-
17
-
18
-
19
-
20
-
21
-
22
-
23
-
24
-
25
-
26
-
27
-
28
-
29
-
30
-
31
-
32
-
33
-
34
-
35
-
36
-
 37
37 -
 38
38 -
 39
39 -
 40
40 -
 41
41 -
 42
42 -
 43
43 -
 44
44 -
 45
45 -
 46
46 -
 47
47 -
 48
48 -
 49
49 -
 50
50 -
 51
51 -
 52
52 -
 53
53 -
 54
54 -
 55
55 -
 56
56 -
 57
57 -
58
-
59
-
60
-
61
-
62
-
63
-
64
-
65
-
66
-
67
-
68
-
69
-
70
-
71
-
72
-
73
-
74
-
75
-
76
-
77
-
78
-
79
-
80
-
81
-
82
-
83
-
84
-
85
-
86
-
87
-
88
-
89
-
90
-
91
-
92
-
93
-
94
-
95
-
96
-
97
-
98
-
99
-
100
-
101
-
102
-
103
-
104
 |
 |

SAFEWAY INC. AND SUBSIDIARIES
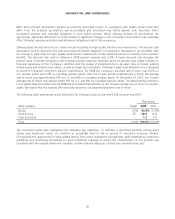
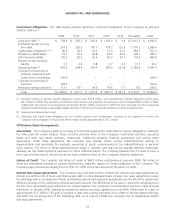
Sensitivity to changes in the major assumptions for Safeway’s pension plans are as follows (dollars in millions):
United States Canada
Percentage
point
change
Projected benefit
obligation
decrease
(increase)
Expense
decrease
(increase)
Projected benefit
obligation
decrease
(increase)
Expense
decrease
(increase)
Expected return on assets +/-1.0 pt – $ 17.2/(17.2) – $ 3.3/(3.3)
Discount rate +/-1.0 pt $ 185.6/(230.5) $ 8.6/(44.3) $ 38.4/(44.3) $ 5.7/(6.2)
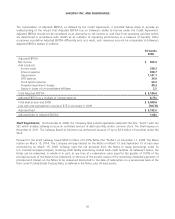
Cash contributions, primarily in Canada, to the Company’s pension plans are expected to total approximately
$25.9 million in 2009 and totaled $33.8 million in 2008, $33.0 million in 2007 and $29.2 million in 2006.
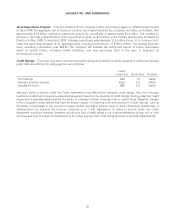
Stock-Based Employee Compensation SFAS No. 123R requires all share-based payments to employees, including
grants of employee stock options, to be recognized in the financial statements as compensation cost based on the fair
value on the date of grant. The Company determines fair value of such awards using the Black-Scholes option pricing
model. The Black-Scholes option pricing model incorporates certain assumptions, such as a risk-free interest rate,
expected volatility, expected dividend yield and expected life of options, in order to arrive at a fair value estimate.
Goodwill Goodwill represents the excess of cost of an acquired business over the fair value of the identifiable tangible
and intangible assets acquired and liabilities assumed in a business combination. In accordance with SFAS No. 142,
“Goodwill and Other Intangible Assets,” goodwill is not subject to amortization but must be evaluated for impairment.
We test goodwill for impairment annually (on the first day of the fourth quarter), or whenever events occur or
circumstances change that would more likely than not reduce the fair value of a reporting unit below its carrying amount,
by initially comparing the fair value of each of our reporting units to their related carrying values. If the fair value of the
reporting unit is less than its carrying value, we perform an additional step to determine the implied fair value of goodwill
associated with that reporting unit. If the carrying value of goodwill exceeds the implied fair value of goodwill, such
excess represents the amount of goodwill impairment. Our goodwill impairment analysis also includes a comparison of
the aggregate estimated fair value of all reporting units to our total market capitalization. Therefore, a significant and
sustained decline in our stock price could result in goodwill impairment charges. During times of financial market
volatility, significant judgment is given to determine the underlying cause of the decline and whether stock price declines
are short-term in nature or indicative of an event or change in circumstances.
Determining the fair value of a reporting unit involves the use of significant estimates and assumptions. The estimate of
fair value of each of our reporting units is based on our projection of sales, gross profit, operating profit and cash flows
considering historical and estimated future results, general economic and market conditions as well as the impact of
planned business and operational strategies. We base our fair value estimates on assumptions we believe to be
reasonable at the time, but such assumptions are subject to inherent uncertainty. Actual results may differ from those
estimates. The valuations employ present value techniques to measure fair value and consider market factors. Based upon
the results of our September 7, 2008 analysis, no impairment of goodwill was indicated.
As of September 7, 2008, if forecasted cash flows had been 10% lower than estimated or if the discount rate applied in
our analysis had been 10% higher than estimated, no goodwill impairment would have been indicated. However,
changes in the judgments and estimates underlying our analysis of goodwill for possible impairment, including expected
future cash flows and discount rate, could result in a significantly different estimate of the fair value of the reporting units
in the future.
Income Tax Contingencies The Company is subject to periodic audits by the Internal Revenue Service and other
foreign, state and local taxing authorities. These audits may challenge certain of the Company’s tax positions such as the
timing and amount of income and deductions and the allocation of taxable income to various tax jurisdictions. Income tax
contingencies are accounted for in accordance with FASB Interpretation No. 48, “Accounting for Uncertainty in Income
Taxes” (“FIN 48”), and may require significant management judgment in estimating final outcomes. Actual
27