Safeway 2008 Annual Report Download - page 42
Download and view the complete annual report
Please find page 42 of the 2008 Safeway annual report below. You can navigate through the pages in the report by either clicking on the pages listed below, or by using the keyword search tool below to find specific information within the annual report.-
 1
1 -
2
-
3
-
4
-
5
-
6
-
7
-
8
-
9
-
10
-
11
-
12
-
13
-
14
-
15
-
16
-
17
-
18
-
19
-
20
-
21
-
22
-
23
-
24
-
25
-
26
-
27
-
28
-
29
-
30
-
31
-
 32
32 -
 33
33 -
 34
34 -
 35
35 -
 36
36 -
 37
37 -
 38
38 -
 39
39 -
 40
40 -
 41
41 -
 42
42 -
 43
43 -
 44
44 -
 45
45 -
 46
46 -
 47
47 -
 48
48 -
 49
49 -
 50
50 -
 51
51 -
 52
52 -
53
-
54
-
55
-
56
-
57
-
58
-
59
-
60
-
61
-
62
-
63
-
64
-
65
-
66
-
67
-
68
-
69
-
70
-
71
-
72
-
73
-
74
-
75
-
76
-
77
-
78
-
79
-
80
-
81
-
82
-
83
-
84
-
85
-
86
-
87
-
88
-
89
-
90
-
91
-
92
-
93
-
94
-
95
-
96
-
97
-
98
-
99
-
100
-
101
-
102
-
103
-
104
 |
 |

SAFEWAY INC. AND SUBSIDIARIES
Item 7. Management’s Discussion and Analysis of Financial Condition and Results of Operations
The last three fiscal years consist of the 53-week period ended January 3, 2009 (“fiscal 2008” or “2008”), the 52-week
period ended December 29, 2007 (“fiscal 2007” or “2007”) and the 52-week period ended December 30, 2006 (“fiscal
2006” or “2006”).
Results of Operations
Economic Outlook The current economic environment has made consumers more cautious. This could lead to reduced
consumer spending, to consumers trading down to a less expensive mix of products or to consumers trading down to
discounters for grocery items, all of which could affect Safeway’s sales growth. Additionally, in this uncertain economy, it
is difficult to forecast whether we are entering a period of inflation or deflation. In 2008, Safeway experienced overall
inflation, while early indications suggest that there may be deflation in certain product categories in 2009. Food deflation
could reduce sales growth, while food inflation, combined with reduced consumer spending, could reduce gross profit
margins.
However, in a slowing economy, some customers may trade down from dining out in restaurants to shopping more at
grocery stores such as Safeway and from purchasing national brand products to purchasing less expensive Safeway
private label brands. Additionally, when fuel prices are high, consumers may switch from shopping at more remote club
and discount stores to Safeway’s more convenient neighborhood locations.
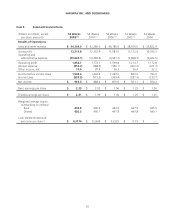
Safeway reported net income of $965.3 million ($2.21 per diluted share) in 2008, $888.4 million ($1.99 per diluted share)
in 2007 and $870.6 million ($1.94 per diluted share) in 2006. Results in fiscal 2006 were affected by a $62.6 million
reduction of income tax expense which is described in this report under the caption “Income Taxes.”
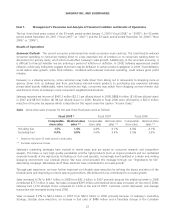
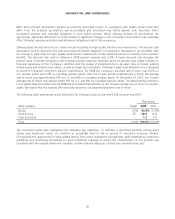
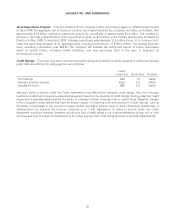
Sales Same-store sales increases for the past three fiscal years were as follows:
Fiscal 2008 * Fiscal 2007 Fiscal 2006
Comparable-
store sales
Identical-store
sales **
Comparable-
store sales
Identical-store
sales **
Comparable-
store sales
Identical-store
sales **
Including fuel 1.5% 1.4% 4.4% 4.1% 4.4% 4.1%
Excluding fuel 0.9% 0.8% 3.6% 3.4% 3.5% 3.3%
* Based on the same 53-week period in both years.
** Excludes replacement stores.
Safeway’s marketing strategies have evolved in recent years and are based on consumer research and competitive
analysis. This helps us carry high quality perishables and the right products (such as organic products and our revitalized
corporate brands) at the right prices (including our club card specials), increasingly merchandised in a warm and inviting
shopping environment (our Lifestyle stores). We have communicated this message through our “Ingredients for life”
advertising campaign. We believe all of these elements have contributed to our sales growth.
Through past experience, we have further improved our Lifestyle store execution by refining the layout and décor of the
Lifestyle store and improving our store opening promotions. We believe this has contributed to our sales growth.
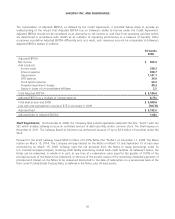
Sales increased 4.3% to $44.1 billion in 2008 from $42.3 billion in 2007 primarily because the additional week in 2008
contributed $777 million in sales, fuel sales increased $397 million and identical-store sales increased. At the end of 2008,
Safeway had 1,276 Lifestyle stores compared to 1,024 at the end of 2007. Customer counts decreased, and average
transaction size increased during fiscal 2008.
Sales increased 5.2% to $42.3 billion in 2007 from $40.2 billion in 2006 primarily because of Safeway’s marketing
strategy, Lifestyle store execution, an increase in fuel sales of $486 million and a favorable change in the Canadian
22