Safeway 2008 Annual Report Download - page 41
Download and view the complete annual report
Please find page 41 of the 2008 Safeway annual report below. You can navigate through the pages in the report by either clicking on the pages listed below, or by using the keyword search tool below to find specific information within the annual report.-
 1
1 -
2
-
3
-
4
-
5
-
6
-
7
-
8
-
9
-
10
-
11
-
12
-
13
-
14
-
15
-
16
-
17
-
18
-
19
-
20
-
21
-
22
-
23
-
24
-
25
-
26
-
27
-
28
-
29
-
30
-
 31
31 -
 32
32 -
 33
33 -
 34
34 -
 35
35 -
 36
36 -
 37
37 -
 38
38 -
 39
39 -
 40
40 -
 41
41 -
 42
42 -
 43
43 -
 44
44 -
 45
45 -
 46
46 -
 47
47 -
 48
48 -
 49
49 -
 50
50 -
 51
51 -
52
-
53
-
54
-
55
-
56
-
57
-
58
-
59
-
60
-
61
-
62
-
63
-
64
-
65
-
66
-
67
-
68
-
69
-
70
-
71
-
72
-
73
-
74
-
75
-
76
-
77
-
78
-
79
-
80
-
81
-
82
-
83
-
84
-
85
-
86
-
87
-
88
-
89
-
90
-
91
-
92
-
93
-
94
-
95
-
96
-
97
-
98
-
99
-
100
-
101
-
102
-
103
-
104
 |
 |

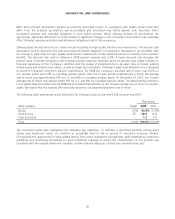
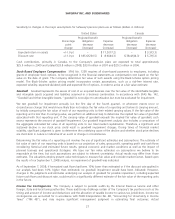
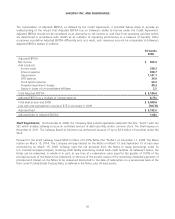
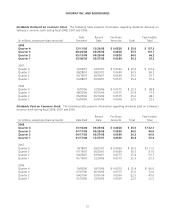
SAFEWAY INC. AND SUBSIDIARIES
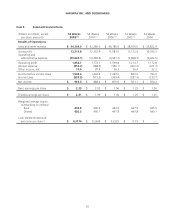
Item 6. Selected Financial Data (continued)
(Dollars in millions, except
per-share amounts)
53 Weeks
2008 (1)
52 Weeks
2007 (1)
52 Weeks
2006 (1)
52 Weeks
2005 (1)
52 Weeks
2004
Financial Statistics
Comparable-store sales
increases (3) 1.5% 4.4% 4.4% 5.9% 0.9%
Identical-store sales increases (3) 1.4% 4.1% 4.1% 5.8% 0.3%
Identical-store sales increases
(decreases) without fuel (3) 0.8% 3.4% 3.3% 4.3% (1.3%)
Gross profit margin 28.38% 28.74% 28.82% 28.93% 29.58%
Operating & administrative
expense as a percentage of
sales (4) 24.17% 24.55% 24.84% 25.77% 26.30%
Operating profit as
a percentage of sales 4.2% 4.2% 4.0% 3.2% 3.3%
Cash capital expenditures $ 1,595.7 $ 1,768.7 $ 1,674.2 $ 1,383.5 $ 1,212.5
Depreciation & amortization $ 1,141.1 $ 1,071.2 $ 991.4 $ 932.7 $ 894.6
Total assets $ 17,484.7 $ 17,651.0 $ 16,273.8 $ 15,756.9 $ 15,377.4
Total debt $ 5,499.8 $ 5,655.1 $ 5,868.1 $ 6,358.6 $ 6,763.4
Total stockholders’ equity $ 6,786.2 $ 6,701.8 $ 5,666.9 $ 4,919.7 $ 4,306.9
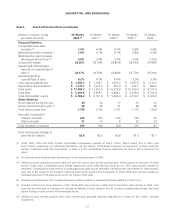
Other Statistics
Stores opened during the year 20 20 17 21 33
Stores closed during the year (5) 24 38 31 48 48
Total stores at year end 1,739 1,743 1,761 1,775 1,802
Remodels completed (6)
Lifestyle remodels 232 253 276 293 92
Other remodels 21 15 8 22 23
Total remodels completed 253 268 284 315 115
Total retail square footage at
year end (in millions) 80.4 80.3 80.8 81.0 82.1
(1) 2008, 2007, 2006 and 2005 include stock-based compensation expense of $62.3 million, $48.4 million, $51.2 million and
$59.7 million, respectively. For additional information, see the caption “Stock-Based Employee Compensation” in Note A and the
caption “Additional Stock Plan Information” in Note G to the consolidated financial statements set forth in Part II, Item 8 of this
report.
(2) No common stock dividends were declared prior to the second quarter of 2005.
(3) Defined as stores operating the same period in both the current year and the previous year. 2008 is based on the same 53-week
period in both years. Comparable stores include replacement stores while identical stores do not. 2005 sales increase includes an
estimated 130-basis-point improvement in comparable-store sales and an estimated 140-basis-point improvement in identical-store
sales due to the impact of the Southern California strike which ended in the first quarter of 2004. 2004 sales increase includes an
estimated reduction of 60 basis points due to the impact of this strike.
(4) Management believes this ratio is relevant because it assists investors in evaluating Safeway’s ability to control costs.
(5) Included 14 Dominick’s store closures in 2007, 26 Randall’s store closures in 2005 and 12 Dominick’s store closures in 2004. Such
store closures were part of a program to improve profitability in those divisions. We do not plan to significantly change total retail
square footage or store count in the foreseeable future.
(6) Defined as store remodel projects (other than maintenance) generally requiring expenditures in excess of $0.2 million. Excludes
acquisitions.
21