Safeway 2008 Annual Report Download - page 78
Download and view the complete annual report
Please find page 78 of the 2008 Safeway annual report below. You can navigate through the pages in the report by either clicking on the pages listed below, or by using the keyword search tool below to find specific information within the annual report.-
 1
1 -
2
-
3
-
4
-
5
-
6
-
7
-
8
-
9
-
10
-
11
-
12
-
13
-
14
-
15
-
16
-
17
-
18
-
19
-
20
-
21
-
22
-
23
-
24
-
25
-
26
-
27
-
28
-
29
-
30
-
31
-
32
-
33
-
34
-
35
-
36
-
37
-
38
-
39
-
40
-
41
-
42
-
43
-
44
-
45
-
46
-
47
-
48
-
49
-
50
-
51
-
52
-
53
-
54
-
55
-
56
-
57
-
58
-
59
-
60
-
61
-
62
-
63
-
64
-
65
-
66
-
67
-
 68
68 -
 69
69 -
 70
70 -
 71
71 -
 72
72 -
 73
73 -
 74
74 -
 75
75 -
 76
76 -
 77
77 -
 78
78 -
 79
79 -
 80
80 -
 81
81 -
 82
82 -
 83
83 -
 84
84 -
 85
85 -
 86
86 -
 87
87 -
 88
88 -
89
-
90
-
91
-
92
-
93
-
94
-
95
-
96
-
97
-
98
-
99
-
100
-
101
-
102
-
103
-
104
 |
 |

SAFEWAY INC. AND SUBSIDIARIES
Notes to Consolidated Financial Statements
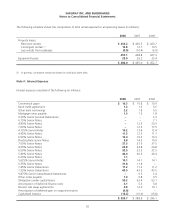
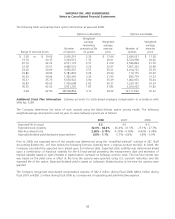
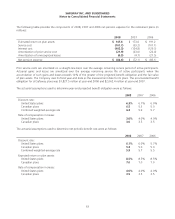
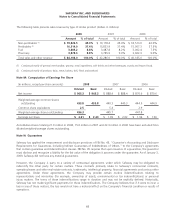
The following table summarizes stock option information at year-end 2008:
Options outstanding Options exercisable
Range of exercise prices
Number
of options
Weighted-
average
remaining
contractual life
(in years)
Weighted-
average
exercise
price
Number of
options
Weighted-
average
exercise
price
$ 2.38 to $ 19.60 3,906,291 2.35 $ 17.66 2,436,031 $ 17.38
19.74 20.15 3,364,513 1.35 20.01 2,720,958 20.02
20.16 22.22 4,551,172 2.37 21.09 2,546,894 21.09
22.28 23.01 4,480,573 3.20 22.97 1,801,333 22.98
23.02 29.69 3,950,257 3.57 25.21 2,014,732 25.39
29.80 29.94 5,781,803 5.06 29.94 119,175 29.93
30.35 34.94 1,390,395 3.30 31.95 855,779 31.33
35.37 35.75 5,656,922 3.90 35.39 1,462,933 35.44
35.83 45.02 1,595,698 2.62 40.27 1,239,142 41.34
45.25 62.50 3,921,230 1.87 51.82 3,920,953 51.82
2.38 62.50 38,598,854 3.12 29.02 19,117,930 30.32
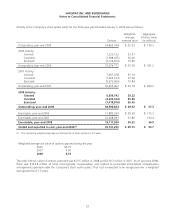
Additional Stock Plan Information Safeway accounts for stock-based employee compensation in accordance with
SFAS No. 123R.
The Company determines fair value of such awards using the Black-Scholes option pricing model. The following
weighted-average assumptions used, by year, to value Safeway’s grants are as follows:
2008 2007 2006
Expected life (in years) 4.5 4.5 4.5
Expected stock volatility 32.0% - 48.3% 26.4% - 31.5% 27.1% - 27.7%
Risk-free interest rate 2.58% - 3.19% 4.30% - 4.78% 4.43% - 4.78%
Expected dividend yield during the expected term 0.8% - 1.1% 0.7% - 0.8% 0.8% - 0.9%
Prior to 2008, the expected term of the awards was determined using the “simplified method” outlined in SEC Staff
Accounting Bulletin No. 107 that utilizes the following formula: ((vesting term + original contract term)/2). In 2008, the
Company calculated the expected term based upon its historical data. Expected stock volatility was determined based
upon a combination of historical volatility for the 4.5-year-period preceding the measurement date and estimates of
implied volatility based on open interests in traded option contracts on Safeway common stock. The risk-free interest rate
was based on the yield curve in effect at the time the options were granted, using U.S. constant maturities over the
expected life of the option. Expected dividend yield is based on Safeway’s dividend policy at the time the options were
granted.
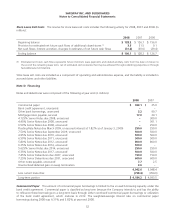
The Company recognized stock-based compensation expense of $62.3 million during fiscal 2008, $48.4 million during
fiscal 2007 and $51.2 million during fiscal 2006 as a component of operating and administrative expense.
58