Safeway 2008 Annual Report Download - page 46
Download and view the complete annual report
Please find page 46 of the 2008 Safeway annual report below. You can navigate through the pages in the report by either clicking on the pages listed below, or by using the keyword search tool below to find specific information within the annual report.-
 1
1 -
2
-
3
-
4
-
5
-
6
-
7
-
8
-
9
-
10
-
11
-
12
-
13
-
14
-
15
-
16
-
17
-
18
-
19
-
20
-
21
-
22
-
23
-
24
-
25
-
26
-
27
-
28
-
29
-
30
-
31
-
32
-
33
-
34
-
35
-
 36
36 -
 37
37 -
 38
38 -
 39
39 -
 40
40 -
 41
41 -
 42
42 -
 43
43 -
 44
44 -
 45
45 -
 46
46 -
 47
47 -
 48
48 -
 49
49 -
 50
50 -
 51
51 -
 52
52 -
 53
53 -
 54
54 -
 55
55 -
 56
56 -
57
-
58
-
59
-
60
-
61
-
62
-
63
-
64
-
65
-
66
-
67
-
68
-
69
-
70
-
71
-
72
-
73
-
74
-
75
-
76
-
77
-
78
-
79
-
80
-
81
-
82
-
83
-
84
-
85
-
86
-
87
-
88
-
89
-
90
-
91
-
92
-
93
-
94
-
95
-
96
-
97
-
98
-
99
-
100
-
101
-
102
-
103
-
104
 |
 |

SAFEWAY INC. AND SUBSIDIARIES
differ from actuarial assumptions because of economic and other factors. In accordance with GAAP, actual results that
differ from the actuarial assumptions are accumulated and amortized over future periods and, therefore, affect
recognized expense and recorded obligation in such future periods. While Safeway believes its assumptions are
appropriate, significant differences in actual results or significant changes in the Company’s assumptions may materially
affect Safeway’s pension and other postretirement obligations and its future expense.
Safeway bases the discount rate on current investment yields on high quality fixed-income investments. The discount rate
assumption used to determine the year-end projected benefit obligation is increased or decreased to be consistent with
the change in yield rates for high quality fixed-income investments for the expected period to maturity of the pension
benefits. The discount rate used to determine 2008 pension expense was 5.9%. A lower discount rate increases the
present value of benefit obligations and increases pension expense. Expected return on pension plan assets is based on
historical experience of the Company’s portfolio and the review of projected returns by asset class on broad, publicly
traded equity and fixed-income indices, as well as target asset allocation. Safeway’s target asset allocation mix is designed
to meet the Company’s long-term pension requirements. For 2008 the Company’s assumed rate of return was 8.5% on
U.S. pension assets and 7.0% on Canadian pension assets. Over the 10-year period ended January 3, 2009, the average
rate of return was approximately 3% for U.S. and 4% for Canadian pension assets. At December 29, 2007, the 10-year
average rate of return was approximately 9% for U.S. and 8% for Canadian pension assets. The deteriorating conditions
in the global financial markets during 2008 led to a substantial reduction in the 10-year average rate of return on pension
assets. We expect that the markets will eventually recover to our assumed long-term rate of return.
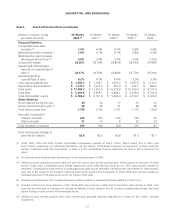
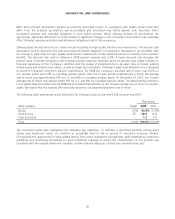
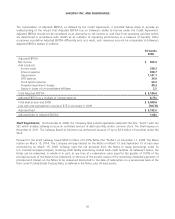
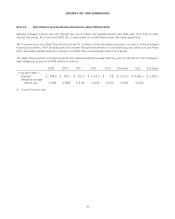
The following table summarizes actual allocations for Safeway’s plans at year-end 2008 and year-end 2007:
Plan assets
Asset category Target 2008 2007
Equity 65% 60.8% 67.8%
Fixed income 35 38.0 31.8
Cash and other – 1.2 0.4
Total 100% 100.0%100.0%
The investment policy also emphasizes the following key objectives: (1) maintain a diversified portfolio among asset
classes and investment styles; (2) maintain an acceptable level of risk in pursuit of long-term economic benefit;
(3) maximize the opportunity for value-added returns from active investment management while establishing investment
guidelines and monitoring procedures for each investment manager to ensure the characteristics of the portfolio are
consistent with the original investment mandate; and (4) maintain adequate controls over administrative costs.
26