Safeway 2008 Annual Report Download - page 65
Download and view the complete annual report
Please find page 65 of the 2008 Safeway annual report below. You can navigate through the pages in the report by either clicking on the pages listed below, or by using the keyword search tool below to find specific information within the annual report.-
 1
1 -
2
-
3
-
4
-
5
-
6
-
7
-
8
-
9
-
10
-
11
-
12
-
13
-
14
-
15
-
16
-
17
-
18
-
19
-
20
-
21
-
22
-
23
-
24
-
25
-
26
-
27
-
28
-
29
-
30
-
31
-
32
-
33
-
34
-
35
-
36
-
37
-
38
-
39
-
40
-
41
-
42
-
43
-
44
-
45
-
46
-
47
-
48
-
49
-
50
-
51
-
52
-
53
-
54
-
 55
55 -
 56
56 -
 57
57 -
 58
58 -
 59
59 -
 60
60 -
 61
61 -
 62
62 -
 63
63 -
 64
64 -
 65
65 -
 66
66 -
 67
67 -
 68
68 -
 69
69 -
 70
70 -
 71
71 -
 72
72 -
 73
73 -
 74
74 -
 75
75 -
76
-
77
-
78
-
79
-
80
-
81
-
82
-
83
-
84
-
85
-
86
-
87
-
88
-
89
-
90
-
91
-
92
-
93
-
94
-
95
-
96
-
97
-
98
-
99
-
100
-
101
-
102
-
103
-
104
 |
 |

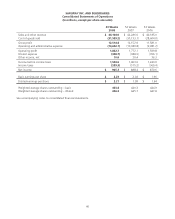
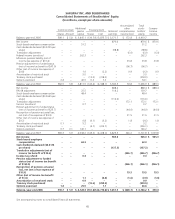
SAFEWAY INC. AND SUBSIDIARIES
Consolidated Statements of Stockholders’ Equity
(In millions, except per-share amounts)
Common stock Additional
paid-in
capital
Treasury stock Retained
earnings
Accumulated
other
comprehensive
income (loss)
Total
stock-
holders’
equity
Compre-
hensive
incomeShares Amount Shares Cost
Balance, year-end 2005 580.1 $ 5.8 $ 3,445.1 (130.7) $ (3,875.7) $ 5,171.7 $ 172.8 $ 4,919.7
Net income – – – – – 870.6 – 870.6 $ 870.6
Stock-based employee compensation – – 51.2 – – – – 51.2 –
Cash dividends declared ($0.2225 per
share) – – – – – (98.8) – (98.8) –
Translation adjustments – – – – – – (6.0) (6.0) (6.0)
Federal income tax refund – – 262.3 – – – – 262.3 –
Minimum pension liability (net of
income tax expense of $10.4) – – – – – – 23.8 23.8 23.8
Pension adjustment to funded status
(net of income tax benefit of $47.9) – – – – – – (96.7) (96.7) –
Other (net of income tax expense of
$0.8) – – 1.0 – (2.2) – 0.9 (0.3) 0.9
Amortization of restricted stock – – 5.0 – – – – 5.0 –
Treasury stock purchased – – – (12.0) (318.0) – – (318.0) –
Options exercised 2.4 – 46.9 0.3 7.2 – – 54.1 –
Balance, year-end 2006 582.5 5.8 3,811.5 (142.4) (4,188.7) 5,943.5 94.8 5,666.9 $ 889.3
Net income – – – – – 888.4 – 888.4 $ 888.4
FIN 48 adjustment – – 25.5 – – 114.2 – 139.7 –
Stock-based employee compensation – – 48.4 – – – – 48.4 –
Cash dividends declared ($0.2645 per
share) – – – – – (116.6) – (116.6) –
Translation adjustments – – – – – – 172.1 172.1 172.1
Income tax refund – – 0.7 – – – – 0.7 –
Pension adjustment to funded status
(net of income tax benefit of $25.7) – – – – – – (44.0) (44.0) (44.0)
Recognition of pension actuarial loss,
net (net of tax expense of $9.9) – – – – – – 21.5 21.5 21.5
Other (net of income tax expense of
$0.2) – – 0.8 (0.1) (3.2) – 1.8 (0.6) 1.8
Amortization of restricted stock 0.1 – 5.2 – – – – 5.2 –
Treasury stock purchased – – – (6.7) (226.1) – – (226.1) –
Options exercised 6.7 0.1 146.1 – – – – 146.2 –
Balance, year-end 2007 589.3 5.9 4,038.2 (149.2) (4,418.0) 6,829.5 246.2 6,701.8 $ 1,039.8
Net income – – – – – 965.3 – 965.3 $ 965.3
Stock-based employee
compensation – – 62.3 – – – – 62.3 –
Cash dividends declared ($0.3174
per share) – – – – – (137.3) – (137.3) –
Translation adjustments (net of
income tax benefit of $10.6) – – – – – – (226.7) (226.7) (226.7)
Income tax refund – – 0.3 – – – – 0.3 –
Pension adjustment to funded
status (net of income tax benefit
of $165.5) – – – – – – (266.1) (266.1) (266.1)
Recognition of pension actuarial
loss, net (net of tax expense of
$10.9) – – – – – – 19.5 19.5 19.5
Other (net of income tax benefit
of $1.4) – – 1.1 – (0.4) – (1.6) (0.9) (1.6)
Amortization of restricted stock – – 0.9 – – – – 0.9 –
Treasury stock purchased – – – (12.6) (359.5) – – (359.5) –
Options exercised 1.4 – 25.5 – 1.1 – – 26.6 –
Balance, year-end 2008 590.7 $ 5.9 $ 4,128.3 (161.8) $ (4,776.8) $ 7,657.5 $ (228.7) $ 6,786.2 $ 490.4
See accompanying notes to consolidated financial statements.
45